
|
시장보고서
상품코드
2034996
중국의 센서 시장 : 점유율 분석, 업계 동향 및 통계, 성장 예측(2026-2031년)China Sensors - Market Share Analysis, Industry Trends & Statistics, Growth Forecasts (2026 - 2031) |
||||||
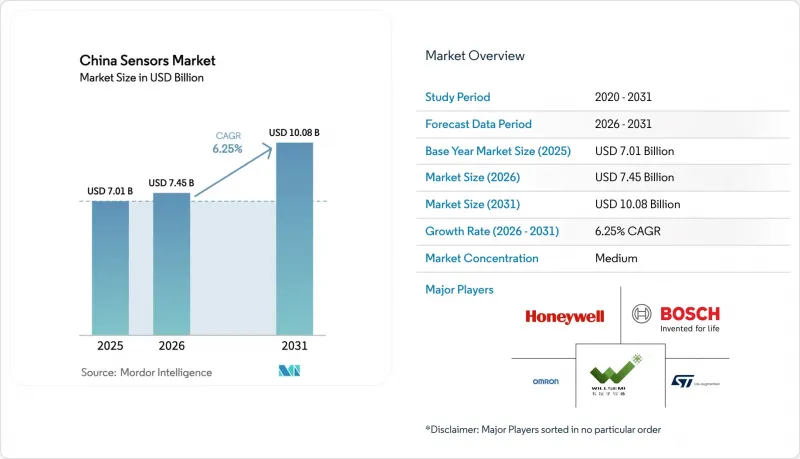
2026년 중국의 센서 시장 규모는 74억 5,000만 달러로 추정되며 2025년 70억 1,000만 달러에서 성장하여 2031년에는 100억 8,000만 달러에 이를 것으로 예측됩니다.
2026년부터 2031년까지 연평균 6.25%의 연평균 복합 성장률(CAGR)을 보일 것으로 예측됩니다.
같은 기간 출하량은 145억 9,000만 대에서 276억 8,000만 대로 증가할 것으로 예상되며, 수량 기준 CAGR은 13.66%를 나타낼 것으로 예측됩니다. 이는 생산 규모 확대에 따라 가격 압박이 가중되고 있음을 보여줍니다. 정책 주도의 현지화, 전기자동차(EV)의 급속한 보급, 대규모 가전제품 제조가 지속적으로 수요를 자극하는 한편, 8인치 MEMS 웨이퍼의 비용 하락으로 인해 대상 최종 시장이 확대되었습니다. 국내 공급업체들이 정부의 인센티브, 웨이퍼 비용 우위, 다운스트림 조립업체와의 지리적 근접성을 활용해 다국적 기존 기업과의 기술 격차를 좁히면서 경쟁 환경이 바뀌었습니다. 지역적으로는 주강 삼각주 가전 클러스터, 양쯔강 삼각주 스마트 제조 허브, 베이징-톈진-허베이의 연구회랑이 3대 성장 동력이 되고 있습니다.
중국의 센서 시장 동향과 인사이트
정부 주도의 '중국제조 2025'를 통한 현지화 추진
대규모 재정적 인센티브와 조달 우선 조치로 주요 센서 부품의 국내 조달률은 2020년 약 40%에서 2025년까지 70%로 상승했습니다. 2025년 초까지 33개 이상의 제조혁신센터가 설립되어 대학과 기업 간 공동연구개발의 거점이 되었습니다. 우대 융자, 신속한 인증, 지적재산권(IP) 지원으로 현지 기업의 진입장벽이 더욱 낮아져 압력, 환경, 관성센서 분야에서 해외 공급업체와 견줄 수 있는 수직통합형 가치사슬을 형성하고 있습니다.
EV 생산량 급증으로 고온, 압력, 전류 센서 수요 급증
2024년 전기차 판매량은 350만 대를 넘어 2023년 이전 수준에서 세 자릿수 성장을 유지했으며, 차량 1대당 센서 탑재량은 연간 8-10%씩 증가했습니다. BYD는 추가 비용 없이 전 차종에 'God's Eye' 스마트 드라이빙 플랫폼을 기본 장착하고, 대중차에도 고급 열 관리, 배터리 압력, 전류 측정 어레이를 표준화했습니다. 이러한 추세에 따라 주요 조립 거점과 가장 가까운 위치에 있는 국내 MEMS 및 션트형 전류센서 제조업체의 수주 잔고가 증가했습니다.
수입 특수 웨이퍼에 대한 의존도가 공급망 리스크를 초래합니다.
국내 팹이 성숙한 노드 생산능력을 확대했음에도 불구하고, 중국은 여전히 고온 센서와 광센서에 사용되는 SOI, SiC, GaN 웨이퍼에 대해 해외 공급업체에 의존하고 있었습니다. 2024년에 시행된 첨단 기판에 대한 새로운 수출 규제 조치는 조달의 불확실성을 높이고, 완충재고를 확보해야 하며, 운전 자금 수요를 증가시켰습니다. 이로 인한 리드타임의 변동은 최첨단 자동차 및 의료기기 생산에 제약이 되었습니다.
부문 분석
2025년 기준, 압력 센서는 중국의 센서 시장 점유율의 18.45%를 차지해 자동차, 산업, 휴대폰에 대한 확고한 도입 실적을 반영했습니다. 환경센서는 시장 규모는 작지만, 국가 대기환경기준 강화와 지방정부의 PM2.5 모니터링 의무화에 힘입어 16.59%의 가장 높은 CAGR을 나타낼 것으로 예측됩니다.
일류 도시의 대기질 측정 거점의 급속한 확장은 초소형 고정밀 가스 및 입자 센서에 대한 수요를 자극하여 예측 기간 동안 중국의 환경 분야 센서 시장 규모를 빠른 속도로 증가시켰습니다. 소비자용 IoT 공기청정기와 스마트홈 기기 역시 판매량을 더욱 확대했습니다. 한편, 유량 및 레벨 센서는 화학 처리 및 수도 유틸리티 프로젝트에서 꾸준히 발전하고 있으며, 진동 및 자기 센서는 구조물 건전성 모니터링 및 자율 항해 이용 사례에서 보급이 확대되고 있습니다.
압전 저항형 부품은 성숙한 패키징 라인과 확립된 설계 IP에 힘입어 2025년에도 매출 점유율 31.75%를 유지했습니다. 한편, 중급 전기차에 ADAS가 보급됨에 따라 LiDAR 유닛은 2031년까지 연평균 복합 성장률(CAGR) 21.53%를 나타낼 것으로 예측됩니다. Hesai와 RoboSense는 2024년까지 총 52만 대 이상의 차량용 LiDAR를 출하할 것으로 예상됐으며, 이는 전 세계 출하량의 3분의 1에 해당합니다.
중국의 LiDAR 센서 시장 규모는 성능 지표를 규정한 GB/T 45500-2025 등 국가 표준을 배경으로 2031년까지 14억 2,000만 달러에 육박할 것으로 예측됩니다. 보완적인 레이더, 정전식 터치센서, 광학 이미저는 멀티모달 인식 어레이를 필요로 하는 소비자 기기 및 산업용 로봇을 위해 두 자릿수 성장세를 유지했습니다.
중국의 센서 시장은 측정 파라미터(온도, 압력, 레벨, 유량, 유량, 근접 등), 작동 모드(광학식, 전기저항식, 바이오센서, 피에조저항식, 이미징, LiDAR 등), 기술(MEMS, CMOS/IC 센서, 광섬유, 양자 및 NV센터, 기타), 그리고 최종 사용자 산업(자동차, 가전, 에너지, 산업/제조, 의료/웰니스 등)으로 구분됩니다.
기타 특전:
- 엑셀 형식 시장 예측(ME) 시트
- 3개월간 애널리스트 지원
자주 묻는 질문
목차
제1장 서론
제2장 조사 방법
제3장 주요 요약
제4장 시장 구도
제5장 시장 규모와 성장 예측
제6장 경쟁 구도
제7장 시장 기회와 향후 전망
JHS 26.05.20China sensors market size in 2026 is estimated at USD 7.45 billion, growing from 2025 value of USD 7.01 billion with 2031 projections showing USD 10.08 billion, growing at 6.25% CAGR over 2026-2031.

Unit shipments are projected to climb from 14.59 billion to 27.68 billion units over the same period, a 13.66% volume CAGR that underscores intensifying price pressure as production scales. Policy-driven localization, rapid electric-vehicle (EV) build-out, and large-scale consumer-electronics manufacturing continued to stimulate demand, while falling 8-inch MEMS wafer costs widened addressable end-markets. Competitive dynamics shifted as domestic suppliers leveraged government incentives, wafer cost advantages, and proximity to downstream assemblers to close technology gaps with multinational incumbents. Geographically, Pearl River Delta consumer-electronics clusters, Yangtze River Delta smart-manufacturing hubs, and Beijing-Tianjin-Hebei research corridors remained the three principal engines of growth.
China Sensors Market Trends and Insights
Government-led "Made in China 2025" localization push
Large-scale fiscal incentives and mandated procurement preferences lifted domestic content in core sensor components toward 70% by 2025, compared with about 40% in 2020. More than 33 Manufacturing Innovation Centres had been launched by early 2025, anchoring joint R&D between universities and enterprises. Preferential financing, expedited certification, and IP support further reduced entry barriers for local firms, fostering a vertically integrated value chain that now rivals overseas suppliers in pressure, environmental, and inertial categories.
EV production surge boosting demand for high-temperature, pressure, and current sensors
EV sales exceeded 3.5 million units in 2024, sustaining a triple-digit expansion from pre-2023 levels and lifting per-vehicle sensor content at an 8-10% annual pace. BYD bundled its 'God's Eye' smart-driving platform across the full model line without extra cost, normalizing advanced thermal-management, battery-pressure, and current-measurement arrays even in mass-market cars. The trend strengthened order books for domestic MEMS and shunt-based current-sensor makers positioned closest to major assembly hubs.
Dependence on imported specialty wafers creates supply-chain risk
Despite domestic fabs adding mature-node capacity, China still relied on overseas suppliers for SOI, SiC, and GaN wafers used in high-temperature and photonic sensors. Renewed export-control measures on advanced substrates in 2024 heightened procurement uncertainty and forced buffer-stock policies, increasing working-capital needs. Resulting lead-time volatility constrained the production of cutting-edge automotive and medical devices.
Other drivers and restraints analyzed in the detailed report include:
- Mass manufacturing of smartphones and IoT wearables clustering in Guangdong
- Smart-factory retrofits across the Yangtze River Delta are accelerating industrial sensor uptake
- Fragmented IP landscape triggering cross-licensing disputes
For complete list of drivers and restraints, kindly check the Table Of Contents.
Segment Analysis
Pressure sensors accounted for 18.45% of China's sensor market share in 2025, reflecting established automotive, industrial, and handset integration footprints. Environmental sensors represented a smaller base yet posted the fastest 16.59% CAGR forecast, propelled by stricter National Ambient Air Quality Standards and municipal PM2.5 monitoring mandates.
Rapid air-quality site build-outs in Tier-1 cities stimulated demand for micro-precision gas and particulate sensors, pushing the China sensors market size for environmental categories at a significant rate during the forecast period. Consumer IoT air-purifiers and smart-home devices further broadened volume. Meanwhile, flow and level sensors advanced steadily in chemical processing and water-utilities projects, while vibration and magnetic devices gained traction in structural health and autonomous navigation use cases.
Piezoresistive components retained a 31.75% revenue share in 2025, anchored by mature packaging lines and well-established design IP. LiDAR units, however, are projected for a 21.53% CAGR through 2031 as ADAS penetration in mid-range EVs climbs. Hesai and RoboSense jointly shipped more than 520,000 automotive LiDARs in 2024, equal to one-third of global deliveries.
The China sensors market size for LiDAR is expected to approach USD 1.42 billion by 2031 on the strength of national standards such as GB/T 45500-2025 that codify performance metrics. Complementary radar, capacitive-touch, and optical imagers sustained double-digit growth, serving consumer devices and industrial robots that require multi-modal perception arrays.
China Sensors Market is Segmented by Parameter Measured (Temperature, Pressure, Level, Flow, Proximity, and More), Mode of Operation (Optical, Electrical Resistance, Biosensors, Piezoresistive, Image, Lidar, and More), Technology (MEMS, CMOS / IC Sensors, Fiber-Optic, Quantum and NV-Centre, and Others), and by End-User Industry (Automotive, Consumer Electronics, Energy, Industrial and Manufacturing, Medical and Wellness, and More).
List of Companies Covered in this Report:
- Bosch Sensortec GmbH
- STMicroelectronics NV
- Honeywell International Inc.
- Omron Corporation
- Infineon Technologies AG
- Texas Instruments Inc.
- Panasonic Corporation
- Sensirion AG
- Hesai Technology Co. Ltd.
- NXP Semiconductors NV
- TDK Corporation (InvenSense)
- Analog Devices Inc.
- Melexis NV
- AAC Technologies Holdings Inc.
- Will Semiconductor Co. Ltd.
- Goertek Inc.
- MEMSensing Microsystems Co. Ltd.
- Novosense Microelectronics
- Hanwei Electronics Group Corp.
- OmniVision Technologies Inc.
- Amphenol Advanced Sensors
- Shanghai Zhaohui Pressure Apparatus Co. Ltd.
- Sinochip Electronics Co. Ltd.
- Hefei 3-Nod Sensor Co. Ltd.
- Silan Microelectronics Co. Ltd.
Additional Benefits:
- The market estimate (ME) sheet in Excel format
- 3 months of analyst support
TABLE OF CONTENTS
1 INTRODUCTION
- 1.1 Study Assumptions and Market Definition
- 1.2 Scope of the Study
2 RESEARCH METHODOLOGY
3 EXECUTIVE SUMMARY
4 MARKET LANDSCAPE
- 4.1 Market Overview
- 4.2 Market Drivers
- 4.2.1 Government-led "Made in China 2025" localisation push for sensor supply-chains
- 4.2.2 EV production surge boosting demand for high-temperature, pressure and current sensors
- 4.2.3 Mass-manufacturing of smartphones and IoT wearables clustering in Guangdong raises MEMS volumes
- 4.2.4 Smart-factory retrofits across Yangtze River Delta accelerating industrial sensor uptake
- 4.2.5 Rising adoption of remote patient-monitoring and digital health platforms driving medical sensors
- 4.2.6 Falling 8-inch MEMS wafer costs from domestic foundries widening sensor addressable markets
- 4.3 Market Restraints
- 4.3.1 Dependence on imported specialty wafers creating supply-chain risk
- 4.3.2 Fragmented IP landscape triggering cross-licensing disputes with incumbents
- 4.3.3 Price wars among local vendors eroding RandD budgets
- 4.3.4 China Cyber-security Law complicating deployment of cloud-connected industrial sensors
- 4.4 Value Chain Analysis
- 4.5 Regulatory Outlook
- 4.6 Technological Outlook
- 4.7 Porter's Five Forces
- 4.7.1 Bargaining Power of Suppliers
- 4.7.2 Bargaining Power of Buyers
- 4.7.3 Threat of New Entrants
- 4.7.4 Threat of Substitutes
- 4.7.5 Degree of Competition
- 4.8 Investment Analysis
- 4.9 Imapct of Macroeconomic Factors on the market
5 MARKET SIZE AND GROWTH FORECASTS (VALUE)
- 5.1 By Parameter Measured
- 5.1.1 Temperature
- 5.1.2 Pressure
- 5.1.3 Level
- 5.1.4 Flow
- 5.1.5 Proximity
- 5.1.6 Environmental (Air-quality, Gas)
- 5.1.7 Chemical
- 5.1.8 Inertial (Accel/Gyro)
- 5.1.9 Magnetic
- 5.1.10 Vibration
- 5.1.11 Other Parameters
- 5.2 By Mode of Operation
- 5.2.1 Optical
- 5.2.2 Electrical Resistance
- 5.2.3 Biosensors
- 5.2.4 Piezoresistive
- 5.2.5 Image
- 5.2.6 Capacitive
- 5.2.7 Piezoelectric
- 5.2.8 LiDAR
- 5.2.9 Radar
- 5.2.10 Other Modes
- 5.3 By Technology
- 5.3.1 MEMS
- 5.3.2 CMOS / IC Sensors
- 5.3.3 Fiber-Optic
- 5.3.4 Quantum and NV-Centre
- 5.3.5 Others (O-NEMS, Thin-Film)
- 5.4 By End-user Industry
- 5.4.1 Automotive
- 5.4.2 Consumer Electronics
- 5.4.2.1 Smartphones
- 5.4.2.2 Tablets, Laptops and PCs
- 5.4.2.3 Wearables
- 5.4.2.4 Smart Home Devices
- 5.4.2.5 Other Consumer Electronics
- 5.4.3 Energy (Generation and Storage)
- 5.4.4 Industrial and Manufacturing
- 5.4.5 Medical and Wellness
- 5.4.6 Construction, Agriculture and Mining
- 5.4.7 Aerospace and Defense
6 COMPETITIVE LANDSCAPE
- 6.1 Market Concentration
- 6.2 Strategic Moves
- 6.3 Market Share Analysis
- 6.4 Company Profiles {(includes Global level Overview, Market level overview, Core Segments, Financials as available, Strategic Information, Market Rank/Share for key companies, Products and Services, and Recent Developments)}
- 6.4.1 Bosch Sensortec GmbH
- 6.4.2 STMicroelectronics NV
- 6.4.3 Honeywell International Inc.
- 6.4.4 Omron Corporation
- 6.4.5 Infineon Technologies AG
- 6.4.6 Texas Instruments Inc.
- 6.4.7 Panasonic Corporation
- 6.4.8 Sensirion AG
- 6.4.9 Hesai Technology Co. Ltd.
- 6.4.10 NXP Semiconductors NV
- 6.4.11 TDK Corporation (InvenSense)
- 6.4.12 Analog Devices Inc.
- 6.4.13 Melexis NV
- 6.4.14 AAC Technologies Holdings Inc.
- 6.4.15 Will Semiconductor Co. Ltd.
- 6.4.16 Goertek Inc.
- 6.4.17 MEMSensing Microsystems Co. Ltd.
- 6.4.18 Novosense Microelectronics
- 6.4.19 Hanwei Electronics Group Corp.
- 6.4.20 OmniVision Technologies Inc.
- 6.4.21 Amphenol Advanced Sensors
- 6.4.22 Shanghai Zhaohui Pressure Apparatus Co. Ltd.
- 6.4.23 Sinochip Electronics Co. Ltd.
- 6.4.24 Hefei 3-Nod Sensor Co. Ltd.
- 6.4.25 Silan Microelectronics Co. Ltd.
7 MARKET OPPORTUNITIES AND FUTURE OUTLOOK
- 7.1 White-space and Unmet-Need Assessment
