
|
연간정보 서비스
상품코드
1661290
에너지 & CO2 데이터베이스Global Energy & CO2 Database |
||||||
분석, 프리젠테이션, 조사에 필요한 유일한 정보원
여러 데이터 소스로 인해 고민할 필요가 없습니다. 이 데이터베이스는 가장 포괄적이고 최신의 에너지 데이터를 제공하며, 186개국의 부문별 에너지 및 배출량 데이터와 추세를 제공합니다. 이 데이터베이스는 가장 평판이 좋은 국내외 정보원을 활용하고 있습니다.

Enerdata는 독점적인 업데이트 프로세스와 검증된 전문성을 바탕으로 탈탄소화, 전기화, 세계 에너지 수급 및 가격, 부문별 온실가스 배출량에 대한 종합적인 통계와 지표를 제공합니다.
가입 혜택
- 종합적인
- 1990년 이후의 에너지 및 온실가스 연간 데이터
- 연간 최대 2000개 이상의 국가별 데이터 시리즈 및 지표
- 186개국 전체 에너지 커버
- 신뢰성
- 에너지 수지 및 통계의 30년 경험
- 최고 수준의 국제 기준(에너지 통계에 관한 국제 권고안-IRES)을 준수하는 데이터 및 지표
- 400개 이상의 세계적인 프리미엄 소스
- 숙련된 데이터 전문가가 검증한 데이터 편집 및 전문 지식 프로세스 제공
- 지속적인 업데이트 : 빠르면 2025년 3월에 2024년 데이터 추정치 제공 가능
- 사용 편의성 : 직관적인 인터페이스, 다양한 데이터 내보내기 형식, 쿼리 저장
- 고객의 작업 환경에 대응
- 모든 데이터는 원시 포맷으로 제공되며, 엑셀 및 csv 포맷으로 다운로드 가능*
- 엑셀 형식과 데이터베이스 형식(행 또는 열 중심)을 모두 사용할 수 있습니다.
- 시계열의 단절이 없어 모델링 작업이 용이합니다.
- 쿼리 저장을 통해 모델과 분석에 주기적으로 연료를 공급합니다.
*125,000값까지
더 많은 지표를 사용할 수 있습니다:
CO2 배출량
- GDP 대비 CO2 원단위
- 부가가치 대비 산업 CO2 원단위
- GDP 대비 수송의 CO2 원단위
- 가정용 개인 소비 대비 CO2 원단위
- 서비스 부가가치 대비 CO2 원단위
- 농업의 부가가치 대비 CO2 원단위
- 전력 생산의 CO2 배출 계수
- 정유공장 CO2 배출량
재생에너지
- 전력 생산에서 재생에너지가 차지하는 비중(수력 포함)
- 전력 생산에서 재생에너지가 차지하는 비중(수력 제외)
- 총 전력 소비량 중 재생에너지가 차지하는 비율
- 1차 소비에서 재생에너지가 차지하는 비율
- 산업 소비에서 바이오매스가 차지하는 비율
- 도로 운송에서 바이오연료의 점유율
에너지 효율
- GDP의 최종 에너지 원단위
- GDP 대비 전력 소비량
- GDP 구성이 일정할 경우의 에너지 원단위
- 산업부문 에너지 원단위
- 가정용 에너지 원단위
- 서비스 에너지 원단위
- 운송의 에너지 원단위
- 농업의 에너지 원단위
- 산업 전력 소비량
- 가정용 전력 소비량
- 서비스 원단위 전력사용량
- 농업의 전력 원단위
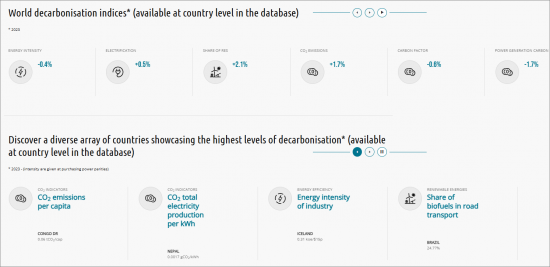
The only source you need for analyses, presentations and research.
Why bother struggling with multiple data sources? Global Energy & CO2 Data brings you the most comprehensive and up-to-date energy database, providing data and trends for all energies by sector as well as emissions for 186 countries. This database leverages the most reputable national and international information sources.
Through an exclusive update process and recognised expertise, Enerdata provides a comprehensive set of statistics and indicators on decarbonisation, electrification, global supply, demand and prices for all energies as well as GHG emissions by sector.
Why Subscribe?
- Comprehensive
- Annual energy and GHG data from 1990 onwards
- Up to 2000+ data series and indicators by country per year
- Coverage of all energies in 186 countries
- Reliable
- 30-year experience in energy balances and statistics
- Data and indicators compliant with the best international norms (International Recommendations for Energy Statistics - IRES)
- 400+ global premium sources
- Proven data compilation and expertise process by experienced data specialists
- Continuously updated: 2024 data estimates available as early as March 2025!
- Easy to use: intuitive interface, multiple data export formats and query saving
- Compatible with your work environment
- All data are available in raw format and downloadable in Excel and csv format*
- Both Excel and database formats (row-oriented or column-oriented) available
- No ruptures in time series means easier modelling work
- Query saving to regularly fuel your model or analysis
*Limited to 125 000 values.
More indicators are available:
On CO2 emissions:
- CO2 intensity to GDP
- CO2 intensity of industry to value added
- CO2 intensity of transport to GDP
- CO2 intensity of households to private consumption
- CO2 intensity of services to value added
- CO2 intensity of agriculture to value added
- CO2 emissions factor of the electricity production
- CO2 emissions from refineries
On renewable energies:
- Share of renewables in electricity production (incl. hydro)
- Share of renewables in electricity production (excl. hydro)
- Share of renewables in gross electricity consumption
- Share of renewables in primary consumption
- Share of biomass in industry consumption
- Share of biofuels in road transport
On energy efficiency:
- Final energy intensity of GDP
- Electricity intensity of GDP
- Energy intensity at constant GDP structure
- Energy intensity of industry
- Energy intensity of households
- Energy intensity of services
- Energy intensity of transport
- Energy intensity of agriculture
- Electricity intensity of industry
- Electricity intensity of households
- Electricity intensity of services
- Electricity intensity of agriculture