
|
연간정보 서비스
상품코드
204521
에너지 시장 예측EnerFuture: Global Energy Forecasts |
||||||
한글목차
※ 본 상품은 영문 자료로 한글과 영문 목차에 불일치하는 내용이 있을 경우 영문을 우선합니다. 정확한 검토를 위해 영문 목차를 참고해주시기 바랍니다.
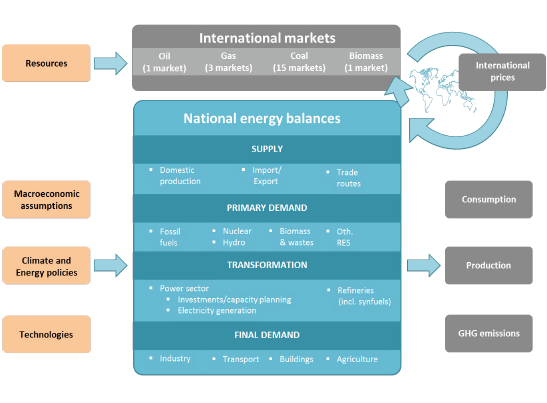
본 온라인 데이터베이스는 Enerdata 독자의 전문성과 세계에서 인정된 POLES 모델을 사용해 2050년까지 세계의 에너지 예측을 제공합니다. 이 서비스는 국가와 지역 차원의 에너지 수요, 발전량, 가격, 에너지원 및 부문별 온실가스 배출량 전망에 대한 명확한 인사이트를 제공합니다.
본 서비스의 구독을 추천하는 이유
- 2050년까지 에너지 연간 수요, 가격, 배출량 예측
- 2018년까지 과거 데이터 - 최신 입수 가능한 수치
- 모든 에너지원의 상세한 예측
- 석유, 가스, 석탄 국제 가격 진화의 통찰력 있는 분석
- 부문별 시장 전망
- 세계 규모, 지역, 국가별 에너지 시장 평가
- 대조적인 3개 에너지 및 기후변화 시나리오
- 지역 밸런스를 고려한 일관성 있는 세계 시장 예측
- 인터랙티브, 사용자 친화적 인터페이스
본 서비스의 주요 특징과 기능
- 세계의 65개 이상 국가, 지역을 커버
- 2018년까지 연간 실적 데이터
- 2050년까지 세계의 에너지 시장 연간 예측
- 석유·가스·석탄 국제 가격 진화 분석
- 분야별·에너지원별 수요·가격 예측
- 최종 에너지 수요의 전기화 진척도에 관한 지표
- 부문별 온실가스 배출량 예측
- 각국의 개요와 순위
- 파워 믹스(기술별 발전능력·발전량)를 5년 단위로 예측
- 기술 개발, 저탄소 에너지원, 화석연료 공급에 관한 대조적인 견해를 나타내는 3개 상세 시나리오
- 수요, CO2, REN 지표
- 거시경제 촉진요인 분석
- 독자적인 데이터베이스나 모델과 통합하기 위한 .csv 형식 데이터 export 기능
출력 데이터
- 에너지/온실가스 배출량 동향 : 석유, 가스, 석탄, 전기, 바이오매스, 온실가스 배출량
- 수요 동향 : 총수요와 부문별 수요 및 최종 에너지 수요의 전기화 진척도에 관한 지표
- 발전 상황 : 에너지 종류별 발전량과 발전 용량 - 화석 에너지, 원자력, 자연에너지(풍력, 태양광 등)
- 부문별 데이터 : 발전, 산업, 수송, 주택/서비스/농업
- 가격 정보 : 국제 에너지 가격

POLES 모델
장기적 에너지 시스템 전망
POLES 모델은 국제적으로 인지되고 있는 기술 경제 모델입니다. 시뮬레이션은 에너지 가격의 내생적인 예측을 이용해 연단위로 행해집니다. 이것은 다수의 에너지 벡터, 관련 기술, 온실가스 배출량의 에너지 수요/공급의 완전한 회계를 제공하고, 가능한 탄소 제약 수준, 에너지 자원 또는 기술적 가정의 맞춤화와 모델링을 가능하게 합니다.
02-2025-2992
(주말 및 공휴일 제외)
(주말 및 공휴일 제외)
검색