|
연간정보 서비스
상품코드
204776
CO2 배출 감축 예측 : 한계저감비용 곡선(MACC)-종합버전Marginal Abatement Cost Curves - MACC |
||||||
한글목차
※ 본 상품은 영문 자료로 한글과 영문 목차에 불일치하는 내용이 있을 경우 영문을 우선합니다. 정확한 검토를 위해 영문 목차를 참고해주시기 바랍니다.
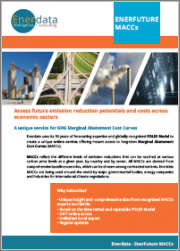
향후의 CO2 배출량 감축 가능성과 각 경제 부문에서의 비용은 어떻게 될까요? Enerdata는 이 분야에 대한 30년에 걸친 Enerdata의 전문 지식과 국제적으로 인정받고 있는 POLES 예측 모델을 활용해서, 장기 MAC(한계저감비용) 곡선에 즉시 접근할 수 있는 독자적인 온라인 서비스를 제공합니다.
한계저감비용 곡선(MACC)은 어느 연도의 어느 국가 부문에 대해 다른 탄소 가격 수준에서 달성 가능한 배출 감축 수준을 제시합니다. 이것들은 완벽한 기초 시나리오로부터 산출됩니다.
MACC는 정책 결정자, 연구자 및 비지니스 애널리스트들이 기후 정책을 평가하고, 그 비용 및 효율을 예측하며, EU 탄소 배출권 거래제(EU ETS) 등 탄소 시장에 대한 시뮬레이션을 행할 때에 사용하는 매우 강력한 툴입니다.
MAC 곡선의 X축은 배출 감축량, Y축은 관련된 탄소 가치, 곡선의 하부는 총 저감비용을 나타냅니다.
nerfuture 서비스에서의 MACC는 POLES-Enerdata 모델을 통해 생성되고 있으며, 5개년(2020년, 2025년, 2030년, 2040년, 2050년), 60개 국가 및 지역, 15개 부문에 대해 2개의 대조적인 기초 시나리오로 구성되어 있습니다.
■ 서론
- 장기 한계저감비용 곡선(2020년, 2025년, 2030년, 2040년, 2050년)
- 출력 데이터 : 탄소 가치에 따른 CO2 감축 예측
- 60개 국가 및 지역의 정보 제공
- 대분류 부문별 CO2 배출량 : 전력, 산업, 수송, 주택 서비스, CO2 총량
- 제공되는 부문(옵션) : 에너지, 산업 연소, 산업 가공, 주택 서비스, 수송
- 기타 지구온난화가스(GHG) - 에너지 및 산업 기원 : Ch4, N2O, SF6, HFC, PFC
- 2개의 시나리오 : 회복 & 불황
- 국제적으로 인정받고 있는 POLES-Enerdata 에너지 예측 모델을 통해 생성
■주요 특징
- 1일 24시간/주 7일 온라인 접속이 가능
- 영어 인터페이스
- 명확한 모델링 방법
- 시나리오별 전제조건의 전달
- 정기적인 갱신
- 데이터 지원시 Enerdata 전문가와 대화
■주요 이점
- 국제적으로 인정받고 있는 손꼽히는 MACC 전문가로부터 데이터 및 분석을 입수
- 강력하고 신뢰할 수 있는 POLES 모델을 통한 정보 제공
■조사 대상 지역 및 국가
| 지역별 에너지 수요 및 CO2 배출 예측 | ||||
|---|---|---|---|---|
| 유럽 | 아메리카 | 아시아 | 아프리카 및 중동 | 독립국가 공동체 |
|
EU-15 EU-25 EU-27 발트 국가 |
라틴아메리카 중미 및 카리브해 국가 남미 |
남아시아 (인도 이외) 동남아시아 (중국, 인도네시아, 한국, 일본 이외) OECD 태평양 국가 |
북아프리카 사하라사막 이남 아프리카 (남아프리카공화국 이외) 중동 만안국가 지중해 국가 (만안국가 이외) |
|
| 국가별 에너지 수요, 가격 및 CO2 배출량 예측 | ||||
|---|---|---|---|---|
| 유럽 | 아메리카 | 아시아 | 아프리카 및 중동 | 독립국가 공동체 |
|
오스트리아 벨기에 불가리아 크로아티아 체코 덴마크 핀란드 프랑스 독일 그리스 헝가리 아일랜드 이탈리아 네덜란드 노르웨이 폴란드 포르투갈 루마니아 슬로바키아 슬로베니아 스페인 스웨덴 스위스 터키 영국 |
브라질 캐나다 멕시코 미국 |
호주 중국 인도 인도네시아 일본 한국 |
이집트 (가격 예측 없음) 알제리, 리비아 모로코, 튀니지 남아프리카공화국 |
러시아 우크라이나 (가격 예측 없음) |
02-2025-2992
(주말 및 공휴일 제외)
(주말 및 공휴일 제외)
검색