


|
연간정보 서비스
상품코드
1459443
IoT 기업용 지출 : 인터랙티브 대시보드 및 네스티드 트래커(2017-2027년)Global IoT Enterprise Spending - An Interactive Dashboard and Nested Tracker Containing Global IoT Enterprise Spending Data from 2019 to 2030 |
||||||
※ 본 상품은 영문 자료로 한글과 영문 목차에 불일치하는 내용이 있을 경우 영문을 우선합니다. 정확한 검토를 위해 영문 목차를 참고해주시기 바랍니다.
세계의 기업에 의한 IoT 지출 동향을 추적 조사하여 IoT 지출액 추정과 예측, 기술·산업·지역 등 각종 세분화별 상세 데이터를 확인할 수 있습니다.
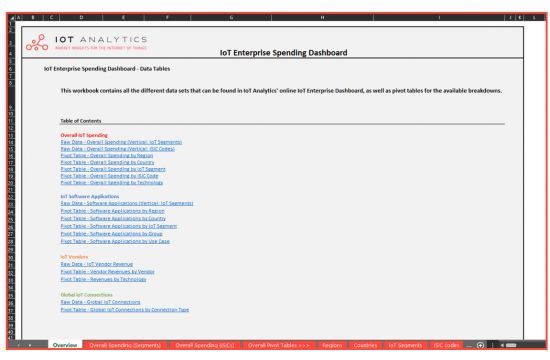
구조화된 시장 데이터베이스 및 웹 툴
IoT 시장 종합적 이해
- 세계의 기업에 의한 IoT 지출, IoT 소프트웨어 & 애플리케이션 지출, 세계의 IoT 접속수 데이터세트를 수록
- 800,000개 이상의 데이터 포인트를 포함하고, 다양한 내역 옵션 제공
- 6개월 마다 최신 데이터로 업데이트됩니다
데이터 구조

데이터 포인트 표시 및 분석
- 세계 7개 지역 100개국 이상
- 10가지 기술 스택 엘리먼트
- 11개 산업 IoT 부문
- 75개 이상 산업
- 170개 이상 벤더
- 40개 이상 사용 사례
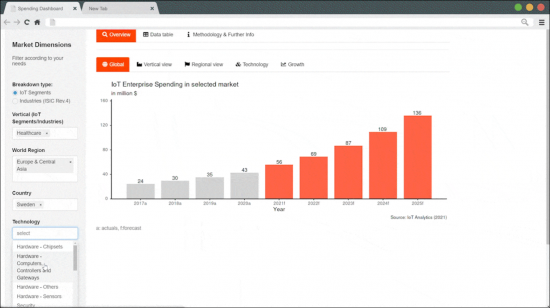
데이터 커스터마이징
필요에 따라 IoT 데이터 활용하기:
- 1. 데이터세트와 내역 유형을 선택합니다
- 2. 산업, 지역, 국가, 기술별로 분석을 시작합니다
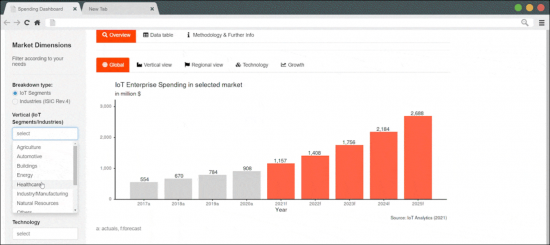
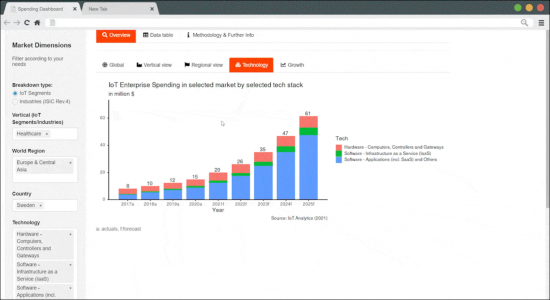
샘플 뷰

- 3. 추출과 필터
- 4. 데이터 내보내기 및 IoT 전략을 백업합니다
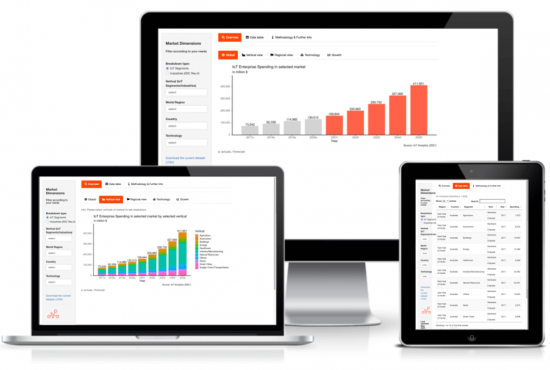
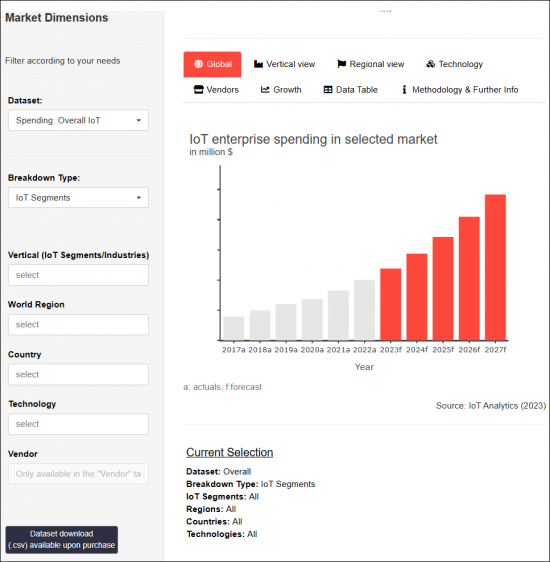
인터랙티브 웹 툴
세계의 IoT 기업용 지출 대시보드
제품 사양
대시보드 전체 정보
대상 산업
|
|
게재 기업
|
|
포함되는 국가
|
|
STRUCTURED MARKET DATABASE AND WEBTOOL

Get a holistic understanding of IoT markets
- Contains datasets for global enterprise IoT spending, IoT software application spending, and global IoT connections.
- Includes 800,000+ data points, with diverse breakdown options
- Gets updated with the most recent data every 6 months.
DATA STRUCTURE
View and analyze data points for:
- 100+ countries from seven world regions
- 10 types of technology stack elements
- 11 vertical IoT segments
- 75+ industries
- 170+ vendors
- 40+ use cases
DATA CUSTOMIZATION
Slice and dice the IoT data to your needs:
- 1. Select the dataset and breakdown type.
- 2. Start your analysis by any vertical, region, country, or technology.
SAMPLE VIEW


- 3. Refine and filter.
- 4. Export data to back up your IoT strategy.
THE INTERACTIVE WEBTOOL
Discover the Global IoT Enterprise Spending Dashboard

THE UPDATE PROCESS
What we do to update the data
Constant monitoring of investor relations documents and news releases for hundreds of IoT companies.
Industry-level forecasting based on revenue estimations of 6,000+ companies.
Numerous interviewing of senior IoT experts from companies across a multitude of industries.
Quantification of trends across 7,000+ earnings calls of listed companies.
Fine-tuning the data based on the latest IoT end-user surveys of ~1,000 IoT and IT decision-makers.
Updating of macroeconomic forecasts from trusted sources (e.g., IMF, World Bank, OECD).
PRODUCT SPECIFICATIONS
All information about the dashboard at a glance
Included industries:
|
|
Included companies:
|
|
Included countries:
|
|


샘플 요청 목록