


|
시장보고서
상품코드
1549548
미국의 수도관 벤더 전략 : 제조 시설, 시장 점유율, 기업 순위U.S. Water Pipe Vendor Strategies: Manufacturing Facilities, Market Share & Company Rankings |
||||||
미국 전 국토에서는 220만 마일의 음료수 배수관과 180만 마일의 폐수 수집관으로 구성된 광대한 지하 인프라 네트워크가 접속된 사람들에게 서비스를 제공하고 있습니다. 그러나 이러한 시스템이 노후화하는 것에 따라 공공 사업에 대한 부담은 증대하며, 연간 약 23만 7,000건의 수도관 파손이 보고되고 있습니다. 이러한 고장은 노후화한 인프라를 교체하고, 수복하기 위한 종합적 어프로치가 급선무인 것을 강하게 나타내고 있습니다.
미국의 수도관 벤더에 대해 조사했으며, 미국의 자치체의 수도관 부문의 현황을 탐색하며, 주요 동향, 시장 성장 촉진요인, 경쟁 구도를 분석하고 있습니다. 또한 시장 점유율의 상세한 분석과 주요 기업 20사의 개요를 제공하고, 이 부문 향후 방향성의 종합적 전망을 제공하고 있습니다.
리포트+데이터 옵션
기업 개요
|
|
언급한 기업
|
|
목차
제1장 수도관 시장의 개요
- 수도관 시장 촉진요인과 억제요인
- 수도관 재료의 사용 실적
- 수도관 재료 조달 지역의 동향
- 시장 점유율 : 재료 유형별, 직경별
- 재료 다양화 부문의 경쟁 상황
- 수도관 벤더의 세분화 : 재료 유형별
- 통합된 밸류체인
- 최근 M&A와 제조 최신 정보
- 매출별 상위 수도관 벤더
- 기업의 순위와 시장 점유율
제2장 미국의 수도관 제조 거점
- 제조 시설
- 미국의 주요 제조업체 : 재료 유형별
- 콘크리트관의 제조 장소
- 강관·다크타일 철관의 제조 장소
- 플라스틱·유리섬유 수도관의 제조 장소
제3장 기업 개요
- Advanced Drainage Systems
- American Cast Iron Pipe Company
- Atkore
- Charlotte Pipe and Foundry Company
- Concrete Pipe and Precast
- County Materials
- Diamond Fiberglass and Fibrex(Adronaco Industries)
- Foley Products Company
- Future Pipe Industries
- GF Piping Systems
- Hobas Pipe
- IPEX(Aliaxis)
- Jensen Precast
- JM Eagle
- McWane
- Northwest Pipe Company
- Oldcastle Infrastructure
- Quikrete
- Thompson Pipe Group
- Westlake Pipe & Fittings
Across the U.S., a vast network of underground infrastructure-comprising 2.2 million miles of drinking water distribution pipes and 1.8 million miles of wastewater collection pipes-serves the connected population. Yet, as these systems age, the burden on utilities intensifies, with approximately 237,000 water line breaks reported annually. These failures highlight the urgent need for a comprehensive approach to replacing and rehabilitating our aging infrastructure.
This Market Share Report delves into the current state of the U.S. municipal pipe sector, examining key trends, market drivers, and the competitive landscape. It also provides a detailed analysis of market share and profiles 20 leading companies, offering a comprehensive view of the sector's future direction.
Report+Data Option

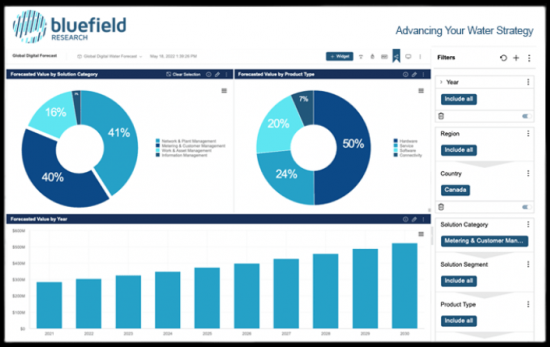
Data is a key component to this analysis. Our team has compiled a relevant data dashboard as an add on purchase option.
Companies Profiled:
|
|
Companies Mentioned:
|
|
Table of Contents
Section 1: Pipe Market Overview
- Key Pipe Market Drivers & Inhibitors
- Historical Pipe Material Usage
- Regional Trends in Pipe Material Sourcing
- Market Share by Material Type and Diameter
- Material Diversification Segments Competitive Landscape
- Pipe Vendor Segmentation by Material Type
- Consolidated Value Chain
- Recent M&A and Manufacturing Updates
- Top Pipe Vendors by Revenue
- Company Ranking and Market Share
Section 2: U.S. Pipe Manufacturing Locations
- Manufacturing Facilities
- Leading U.S. Manufacturers by Material Type
- Concrete Pipe Manufacturing Sites
- Steel and Ductile Iron Pipe Manufacturing Sites
- Plastic and Fiberglass Pipe Manufacturing Sites
Section 3: Company Profiles
- Advanced Drainage Systems
- American Cast Iron Pipe Company
- Atkore
- Charlotte Pipe and Foundry Company
- Concrete Pipe and Precast
- County Materials
- Diamond Fiberglass and Fibrex (Adronaco Industries)
- Foley Products Company
- Future Pipe Industries
- GF Piping Systems
- Hobas Pipe
- IPEX (Aliaxis)
- Jensen Precast
- JM Eagle
- McWane
- Northwest Pipe Company
- Oldcastle Infrastructure
- Quikrete
- Thompson Pipe Group
- Westlake Pipe & Fittings
(주말 및 공휴일 제외)
