|
시장보고서
상품코드
1757090
커넥터 산업 연감(2025년)2025 Connector Industry Yearbook |
||||||
Bishop & Associates는 매년 상장된 커넥터 기업들이 제출한 연간 보고서를 기반으로 '커넥터 산업 연감'을 발간합니다. 이 연감에는 지난 10년, 5년, 그리고 가장 최근 연도의 손익계산서와 대차 대조표가 통합되어 산업 전반의 현황과 상장 커넥터 기업의 전체적인 성과를 비교할 수 있는 기준점을 제공합니다.
또한 이 보고서는 2014년부터 2024년까지 지역별 매출, 최종 사용 장비 부문별 산업 동향을 분석하며, 2025년과 2030년 지역별 및 최종 사용 장비 부문별 현재 전망을 제공합니다.
이 보고서의 특징
다음을 포함하는 게시자의 연결 내역 :
- 주요 재무 지표(2014-2024년)
- 대차 대조표(2014-2024년)
- 손익계산서(2014-2024년)
- 대차 대조표 비율(2014-2024년)
- 손익계산서 비율(2014-2024년)
기업별 15년 실적 역사 및 다음과 같은 재무 지표의 산업 평균 :
- 판매비 및 일반 관리비(2010-2024년)
- 순이익률(2010-2024년)
- 자산 수익률 (2010-2024년)
- 장기 부채/자본 비율(2010-2024년)
- 매출채권 회전율(2010-2024년)
- 재고 회전율(2010-2024년)
- 매출원가 비율(2010-2024년)
- 매출원가 + 판매 및 일반 관리비 비율(2010-2024년)
- 유동 비율(2010-2024년)
- 자기자본수익률(2010-2024년)
- 부채/자본 비율(2010-2024년)
- 평균 회수 기간(2010-2024년)
- 재고 일수(2010-2024년)
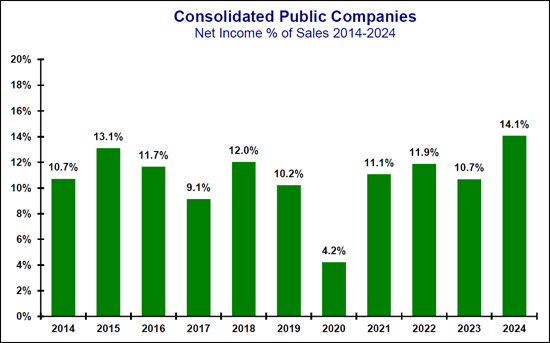
2024년 연감 기업 순이익 매출액 대비 비율
다음 표는 2025년 커넥터 산업 연감에 포함된 상장 기업의 2014년부터 2024년까지의 매출 대비 순이익 비율을 보여줍니다.

순이익
2024년 커넥터 산업의 평균 순이익은 매출의 14.1%였습니다. 2018년은 미국에서 세금 감면 및 고용 법안이 통과된 중요한 해였습니다. 이 법안은 연방 법인 소득세를 35%에서 21%로 인하했습니다. 세계의적인 코로나19 팬데믹으로 인해 2020년에 매출 대비 순이익률이 4.2%로 가장 낮은 수준을 기록했습니다. 2015년부터 2019년까지 순이익률은 2015년 13.1%에서 2019년 10.2%로 감소했습니다. 2020년부터 2024년까지 순이익은 2020년 4.2%에서 2024년 14.1%로 증가했습니다.
다음 차트는 2010년부터 2024년까지 커넥터 산업의 순이익 변동 내역을 보여줍니다.

목차
프롤로그
제1장 세계의 전자 커넥터 산업
- 과거 10년간(2014-2024년)
- 과거 5년간(2019-2024년)
- 작년(2024년)
- 기기 부문별 매출(2022-2024년)
- 기기 부문별 매출액
- 지역별 예측(2025년, 2030년)
- 주요 기술 동향
- 리드 타임
- 가격 동향
제2장 주요 사건
제3장 - 연결 주요 성과 평가 지표
통합 주요 성과 지표
기업별 실적 내역
매출원가
판매 및 일반 관리비(SG&A)
매출원가 판매 및 일반 관리비
순이익 추이
유동 비율
자산 수익률
자기자본수익률
장기부채/자본 비율
부채/자본 비율
매출채권 회전율
평균 회수 기간
재고 회전율
재고 일수
제4장 선정기업의 실적 이력
주요 기업의 성과 내역
Amphenol Corporatio
- 주요 재무 지표
- 차트 : 주요 재무 지표
- 대차 대조표(달러)(2014-2024년)
- 대차 대조표(%)(2014-2024년)
- 손익계산서(달러)(2014-2024년)
- 손익계산서 비율(2014-2024년)
Cheng Uei Precision Co. Ltd.(Foxlink)
- 주요 재무 지표
- 차트 : 주요 재무 지표
- 대차 대조표(달러)(2014-2024년)
- 대차 대조표(%)(2014-2024년)
- 손익계산서(달러)(2014-2024년)
- 손익계산서 비율(2014-2024년)
FIT Hon Teng Ltd
- 주요 재무 지표
- 차트 : 주요 재무 지표
- 대차 대조표(달러)(2014-2024년)
- 대차 대조표(%)(2014-2024년)
- 손익계산서(달러)(2014-2024년)
- 손익계산서 비율(2014-2024년)
Hirose Electric Co., Ltd
- 주요 재무 지표
- 차트 : 주요 재무 지표
- 대차 대조표(달러)(2014-2024년)
- 대차 대조표(%)(2014-2024년)
- 손익계산서(달러)(2014-2024년)
- 손익계산서 비율(2014-2024년)
Hosiden
- 주요 재무 지표
- 차트 : 주요 재무 지표
- 대차 대조표(달러)(2014-2024년)
- 대차 대조표(%)(2014-2024년)
- 손익계산서(달러)(2014-2024년)
- 손익계산서 비율(2014-2024년)
HUBER SUHNER
- 주요 재무 지표
- 차트 : 주요 재무 지표
- 대차 대조표(달러)(2014-2024년)
- 대차 대조표(%)(2014-2024년)
- 손익계산서(달러)(2014-2024년)
- 손익계산서 비율(2014-2024년)
Japan Aviation Electronics Industry(JAE), Limited
- 주요 재무 지표
- 차트 : 주요 재무 지표
- 대차 대조표(달러)(2014-2024년)
- 대차 대조표(%)(2014-2024년)
- 손익계산서(달러)(2014-2024년)
- 손익계산서 비율(2014-2024년)
Korea Electric Terminal Co. Ltd.
- 주요 재무 지표
- 차트 : 주요 재무 지표
- 대차 대조표(달러)(2014-2024년)
- 대차 대조표(%)(2014-2024년)
- 손익계산서(달러)(2014-2024년)
- 손익계산서 비율(2014-2024년)
SMK
- 주요 재무 지표
- 차트 : 주요 재무 지표
- 대차 대조표(달러)(2014-2024년)
- 대차 대조표(%)(2014-2024년)
- 손익계산서(달러)(2014-2024년)
- 손익계산서 비율(2014-2024년)
TE Connectivity
- 주요 재무 지표
- 차트 : 주요 재무 지표
- 대차 대조표(달러)(2014-2024년)
- 대차 대조표(%)(2014-2024년)
- 손익계산서(달러)(2014-2024년)
- 손익계산서 비율(2014-2024년)
Each year, Bishop & Associates prepares the Connector Industry Yearbook based on annual reports provided by publicly traded connector companies. Income statements and balance sheets are consolidated for the past 10 years, five years, and most current year, providing benchmarks on the industry and the overall performance of the public connector companies.
In addition, the report provides a review of the connector industry for the period 2014-2024 for sales by region, end-use equipment sector and our current forecast for 2025 and 2030 by region and end-use equipment sector.
This report features:
Consolidated history of the public companies including:
- Key Financial Measurements (2014-2024)
- Balance Sheet $ (2014-2024)
- Income Statement $ (2014-2024)
- Balance Sheet percent (2014-2024)
- Income Statement percent (2014-2024)
Fifteen-year history of performance by company, with industry averages for the following financial measurements:
- Selling, General, & Administrative percent (2010-2024)
- Net Income percent (2010-2024)
- Return on Assets (2010-2024)
- Long Term Debt/Equity (2010-2024)
- Accounts Receivables Turnover (2010-2024)
- Inventory Turns (2010-2024)
- Cost of Goods Sold percent (2010-2024)
- COGS + SG&A percent (2010-2024)
- Current Ratio (2010-2024)
- Return on Equity (2010-2024)
- Liabilities to Equity (2010-2024)
- Average Collection Period (2010-2024)
- Days Inventory (2010-2024)
2024 Yearbook Companies Net Income as a Percent of Sales
The following table provides Net Income as a percent of sales from 2014-2024 for public companies included in the 2025 Connector Industry Yearbook.
Net Income
In 2024 the connector industry had an average net income of 14.1% of sales. 2018 was a significant year in the United States because it was the year the Tax Cuts and Jobs Act was passed. This act reduced the federal corporate income tax from 35% to 21%. As a result of the worldwide COVID pandemic, the lowest net income as a percent of sales occurred in 2020 at 4.2%. Between 2015 and 2019, net income decreased from 13.1% of sales in 2015 to 10.2% of sales in 2019. Between 2020 and 2024, net income increased from 4.2% in 2020 to 14.1% in 2024.
The following chart provides a history of net income for the Connector Industry from 2010-2024.
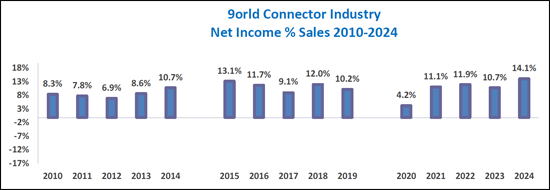
TABLE OF CONTENTS
PROLOGUE
CHAPTER 1 - THE WORLD ELECTRONIC CONNECTOR INDUSTRY
- The Last Ten Years (2014-2024)
- Table: Sales by Geographic Region
- Graph: Change by Region 2014 vs 2024
- The Last Five Years (2019-2024)
- Table: Sales by Geographic Region
- Graph: World Connector Industry - Year-To-Year Percent
- Change in Growth 1980-2025F
- Graph: North American Market Year-to-Year Growth 1980-2025F
- Graph: European Market Year-to-Year Growth 1980-2025F
- Graph: Japanese Market Year-to-Year Growth 1980-2025F
- Graph: Chinese Market Year-to-Year Growth 1995-2025F
- Graph: Asia Pacific Market Year-to-Year Growth 1980-2025F
- Graph: ROW Market Year-to-Year Growth 1980-2025F
- Last Year - 2024
- Table: 2022, 2023 and 2024 Percent Change in Growth Region
- Table: 2022, 2023 and 2024 Percent Share of Market by Region
- Equipment Sector Sales - 2022-2024
- Table: 2022-2024 Percent Change in Equipment Sales by Equipment Sector
- Graph: 2023-2024 Percent Change World Connector
- Sales by Equipment Sector
- Table: 2024 World Sales by Equipment Sector
- Graph: 2024 World Connector Market Top 5 Equipment Sectors
- Forecast 2025 and 2030 by Region
- Table: 2025 & 2030 Forecast by End-Use Market
- Graph: 2025 and 2030 End-Use Market Five-Year CAGR Mergers and Acquisitions
- Key Technology Trends
- Lead Times
- Price Trends
CHAPTER 2 - SIGNIFICANT EVENTS
CHAPTER 3 - CONSOLIDATED KEY PERFORMANCE MEASURES
Consolidated Key Performance Measures
- Key Financial Measurements (2014-2024)
- Charts: Key Financial Measurements
- Balance Sheet $ (2014-2024)
- Balance Sheet % (2014-2024)
- Income Statement $ (2014-2024)
- Income Statement % (2014-2024)
Performance History by Company
- Selected Connector Manufacturers
Cost-of-Goods Sold
- Cost of Goods Sold % (2010-2024)
Selling, General & Administrative (SG&A)
- Selling, General, & Administrative % (2010-2024)
COGS+SG&A
- COGS + SG&A % (2010-2024)
Net Income History
- Net Income % (2010-2024)
Current Ratio
- Current Ratio (2010-2024)
Return on Assets
- Return on Assets (2010-2024)
Return on Equity
- Return on Equity (2010-2024)
Long Term Debt/Equity
- Long Term Debt/Equity (2010-2024)
Liabilities to Equity
- Liabilities to Equity (2010-2024)
Accounts Receivable Turnover
- Accounts Receivables Turnover (2010-2024)
Average Collection Period
- Average Collection Period (2010-2024)
Inventory Turns
- Inventory Turns (2010-2024)
Days Inventory
- Days Inventory (2010-2024)
CHAPTER 4 - PERFORMANCE HISTORY OF SELECTED COMPANIES
Performance History of Selected Companies
Amphenol Corporation
- Key Financial Measurements
- Charts: Key Financial Measurements
- Balance Sheet $ (2014-2024)
- Balance Sheet % (2014-2024)
- Income Statement $ (2014-2024)
- Income Statement % (2014-2024)
Cheng Uei Precision Co. Ltd. (Foxlink)
- Key Financial Measurements
- Charts: Key Financial Measurements
- Balance Sheet $ (2014-2024)
- Balance Sheet % (2014-2024)
- Income Statement $ (2014-2024)
- Income Statement % (2014-2024)
FIT Hon Teng Ltd
- Key Financial Measurements
- Charts: Key Financial Measurements
- Balance Sheet $ (2014-2024)
- Balance Sheet % (2014-2024)
- Income Statement $ (2014-2024)
- Income Statement % (2014-2024)
Hirose Electric Co., Ltd
- Key Financial Measurements
- Charts: Key Financial Measurements
- Balance Sheet $ (2014-2024)
- Balance Sheet % (2014-2024)
- Income Statement $ (2014-2024)
- Income Statement % (2014-2024)
Hosiden
- Key Financial Measurements
- Charts: Key Financial Measurements
- Balance Sheet $ (2014-2024)
- Balance Sheet % (2014-2024)
- Income Statement $ (2014-2024)
- Income Statement % (2014-2024)
HUBER+SUHNER
- Key Financial Measurements
- Charts: Key Financial Measurements
- Balance Sheet $ (2014-2024)
- Balance Sheet % (2014-2024)
- Income Statement $ (2014-2024)
- Income Statement % (2014-2024)
Japan Aviation Electronics Industry (JAE), Limited
- Key Financial Measurements
- Charts: Key Financial Measurements
- Balance Sheet $ (2014-2024)
- Balance Sheet % (2014-2024)
- Income Statement $ (2014-2024)
- Income Statement % (2014-2024)
Korea Electric Terminal Co. Ltd.
- Key Financial Measurements
- Charts: Key Financial Measurements
- Balance Sheet $ (2014-2024)
- Balance Sheet % (2014-2024)
- Income Statement $ (2014-2024)
- Income Statement % (2014-2024)
SMK
- Key Financial Measurements
- Charts: Key Financial Measurements
- Balance Sheet $ (2014-2024)
- Balance Sheet % (2014-2024)
- Income Statement $ (2014-2024)
- Income Statement % (2014-2024)
TE Connectivity
- Key Financial Measurements
- Charts: Key Financial Measurements
- Balance Sheet $ (2014-2024)
- Balance Sheet % (2014-2024)
- Income Statement $ (2014-2024)
- Income Statement % (2014-2024)