|
시장보고서
상품코드
1705911
핵의학 영상 장비 시장 : 제품 유형별, 용도별, 최종사용자별, 지역별Nuclear Imaging Equipment Market, By Product Type, By Application, By End User, By Geography |
||||||
핵의학 영상 장비 세계 시장은 2025년에 35억 7,000만 달러, 2032년에는 50억 6,000만 달러에 달하고, 2025-2032년 5.1%의 연평균 복합 성장률(CAGR)로 성장할 것으로 예측됩니다.
| 보고 범위 | 보고서 상세 내용 | ||
|---|---|---|---|
| 기준 연도 | 2024년 | 2025년 시장 규모 | 35억 7,000만 달러 |
| 실적 데이터 | 2020-2024년 | 예측 기간 | 2025-2032년 |
| 예측 기간(2025-2032년) CAGR | 5.10% | 2032년 가치 예측 | 50억 6,000만 달러 |

핵의학은 소량의 방사성 물질을 사용하여 여러 유형의 암, 심장병, 체내의 다른 특정 이상을 포함한 다양한 질병을 진단하거나 치료하는 의료 영상 진단의 한 분야입니다. 핵의학 영상진단은 장기, 조직, 뼈의 기능을 기반으로 의학적 문제의 원인을 파악합니다. 이 점이 엑스레이 검사나 초음파 검사 등 구조적인 외형을 통해 질병의 유무를 판단하는 진단 검사와 다른 점입니다. 핵의학 또는 방사성 핵종에 의한 영상 검사는 비침습적이고 일반적으로 통증이 없는 의료 검사로 의사가 병을 진단하는 데 도움이 됩니다. 이러한 영상 검사에는 방사성 의약품 또는 방사성 추적자라고 불리는 방사성 물질이 사용됩니다. 핵의학 검사의 유형에 따라 방사성 추적자는 정맥에 주사하거나, 삼키거나, 기체로 흡입하여 최종적으로 검사 대상 장기나 부위에 축적되어 감마선 형태로 에너지를 방출합니다. 이 에너지는 감마 카메라,(양전자 단층촬영) PET 스캐너, 프로브라는 장치로 감지됩니다.
시장 역학:
다양한 암의 세계 유병률 증가는 예측 기간 동안 시장 성장을 가속할 것으로 예측됩니다. 또한, 시장 개척(R&D) 증가와 시장 진출기업의 제품 출시 증가는 예측 기간 동안 시장 성장을 가속할 것으로 예측됩니다. 예를 들어, 미국 암협회가 2021년 2월 4일 발표한 자료에 따르면, 2020년 전 세계적으로 약 1,930만 명의 신규 암환자와 1,000만 명의 암 사망자가 발생할 것으로 추정됩니다.
목차
제1장 조사 목적과 전제조건
- 조사 목적
- 전제조건
- 약어
제2장 시장 전망
- 보고서 설명
- 시장 정의와 범위
- 주요 요약
- Coherent Opportunity Map(COM)
제3장 시장 역학, 규제, 동향 분석
- 시장 역학
- 성장 촉진요인
- 성장 억제요인
- 기회
- 주요 하이라이트
- 규제 시나리오
- 최근 동향
- 제품 발매/승인
- PEST 분석
- PORTER 분석
- 합병, 인수 및 제휴
제4장 세계의 핵의학 영상 장비 시장 - COVID-19 팬데믹의 영향
- COVID-19 역학
- 공급측과 수요측 분석
- 경제에 대한 영향
제5장 세계의 핵의학 영상 장비 시장, 제품 유형별, 2020년-2032년
- 단일 광자 방출 컴퓨터 단층촬영(SPECT)
- 양전자 방출 단층촬영(PET)
- 하이브리드 PET-CT
- 하이브리드 SPECT-CT
- 하이브리드 PET-MRI
- 기타
제6장 세계의 핵의학 영상 장비 시장, 용도별, 2020년-2032년
- 종양학
- 심장병학
- 신경학
- 기타
제7장 세계의 핵의학 영상 장비 시장, 최종사용자별, 2020년-2032년
- 병원 및 진료소
- 영상진단센터
- 연구기관
- 기타
제8장 세계의 핵의학 영상 장비 시장, 지역별, 2020년-2032년
- 북미
- 유럽
- 아시아태평양
- 라틴아메리카
- 중동
- 아프리카
제9장 경쟁 구도
- 기업 개요
- GE Healthcare
- Siemens Healthineers
- Philips Healthcare
- Canon Medical Systems
- Mediso Medical Imaging Systems
- MIE America
- DDD Diagnostic
- Segami
- Digirad
제10장 섹션
- 참고 문헌
- 조사 방법
- 출판사에 대해
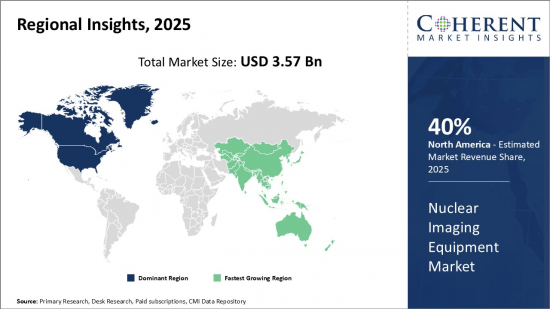
Global Nuclear Imaging Equipment Market is estimated to be valued at USD 3.57 Bn in 2025 and is expected to reach USD 5.06 Bn by 2032, growing at a compound annual growth rate (CAGR) of 5.1% from 2025 to 2032.
| Report Coverage | Report Details | ||
|---|---|---|---|
| Base Year: | 2024 | Market Size in 2025: | USD 3.57 Bn |
| Historical Data for: | 2020 To 2024 | Forecast Period: | 2025 To 2032 |
| Forecast Period 2025 to 2032 CAGR: | 5.10% | 2032 Value Projection: | USD 5.06 Bn |
Nuclear medicine is a branch of medical imaging that uses small amounts of radioactive material to diagnose or treat a variety of diseases, including many types of cancers, heart disease and certain other abnormalities within the body. Nuclear imaging determines the cause of the medical problem based on the function of the organ, tissue or bone. This is how nuclear imaging differs from an X-ray, ultrasound or any other diagnostic test that determines the presence of disease based on structural appearance. Nuclear medicine or radionuclide imaging procedures are noninvasive and usually painless medical tests that help physicians diagnose medical conditions. These imaging scans use radioactive materials called radiopharmaceuticals or radiotracers. Depending on the type of nuclear medicine exam are done, the radiotracer is either injected into a vein, swallowed or inhaled as a gas and eventually accumulates in the organ or area of your body being examined, where it gives off energy in the form of gamma rays. This energy is detected by a device called a gamma camera, a (positron emission tomography) PET scanner and/or probe.
Market Dynamics:
Increasing prevalence of various cancers globally is expected to propel the market growth over the forecast period. Moreover, increasing research and development (R&D) and increasing product launches by the market players will aid in the market growth over the forecast period. For instance, according to the data published by the American Cancer Society on February 4, 2021, worldwide, an estimated 19.3 Mn new cancer cases and 10 Mn cancer deaths occurred in 2020.
Detailed Segmentation:
- Global Nuclear Imaging Equipment Market, By Product Type
- Single Photon Emission Computed Tomography (SPECT)
- Positron Emission Tomography (PET)
- Hybrid PET-CT
- Hybrid SPECT-CT
- Hybrid PET-MRI
- Others
- Global Nuclear Imaging Equipment Market, By Application
- Oncology
- Cardiology
- Neurology
- Others
- Global Nuclear Imaging Equipment Market, By End User
- Hospitals and clinics
- Diagnostic imaging centers
- Research institutes
- Others
- Global Nuclear Imaging Equipment Market, By Region
- North America
- Europe
- Asia Pacific
- Latin America
- Middle East and Africa
- Company Profiles
- GE Healthcare
- Siemens Healthineers
- Philips Healthcare
- Canon Medical Systems
- Mediso Medical Imaging Systems
- MIE America
- DDD Diagnostic
- Segami
- Digirad
Table of Contents
1. Research Objectives and Assumptions
- Research Objectives
- Assumptions
- Abbreviations
2. Market Purview
- Report Description
- Market Definition and Scope
- Executive Summary
- Market Snippet, By Product Type
- Market Snippet, By Application
- Market Snippet, By End User
- Market Snippet, By Region
- Coherent Opportunity Map (COM)
3. Market Dynamics, Regulations, and Trends Analysis
- Market Dynamics
- Drivers
- Increasing incidence of cancer & cardiac disease
- Technological advancements in imaging modalities
- Restraints
- High cost of nuclear imaging modalities
- Opportunities
- Hybrid imaging modalities
- Key Highlights
- Regulatory Scenario
- Recent Trends
- Product Launches/Approvals
- PEST Analysis
- PORTER's Analysis
- Mergers, Acquisitions, and Collaborations
4. Global Nuclear Imaging Equipment Market- Impact of Coronavirus (COVID-19) Pandemic
- COVID-19 Epidemiology
- Supply Side and Demand Side Analysis
- Economic Impact
5. Global Nuclear Imaging Equipment Market, By Product Type, 2020-2032, (US$ Bn)
- Introduction
- Market Share Analysis, 2025 and 2032 (%)
- Y-o-Y Growth Analysis, 2021 - 2032
- Segment Trends
- Single Photon Emission Computed Tomography (SPECT)
- Introduction
- Market Size and Forecast, and Y-o-Y Growth, 2020-2032,(US$ Bn)
- Positron Emission Tomography (PET)
- Introduction
- Market Size and Forecast, and Y-o-Y Growth, 2020-2032,(US$ Bn)
- Hybrid PET-CT
- Introduction
- Market Size and Forecast, and Y-o-Y Growth, 2020-2032,(US$ Bn)
- Hybrid SPECT-CT
- Introduction
- Market Size and Forecast, and Y-o-Y Growth, 2020-2032,(US$ Bn)
- Hybrid PET-MRI
- Introduction
- Market Size and Forecast, and Y-o-Y Growth, 2020-2032,(US$ Bn)
- Others
- Introduction
- Market Size and Forecast, and Y-o-Y Growth, 2020-2032,(US$ Bn)
6. Global Nuclear Imaging Equipment Market, By Application, 2020-2032, (US$ Bn)
- Introduction
- Market Share Analysis, 2025 and 2032 (%)
- Y-o-Y Growth Analysis, 2021 - 2032
- Segment Trends
- Oncology
- Introduction
- Market Size and Forecast, and Y-o-Y Growth, 2020-2032,(US$ Bn)
- Cardiology
- Introduction
- Market Size and Forecast, and Y-o-Y Growth, 2020-2032,(US$ Bn)
- Neurology
- Introduction
- Market Size and Forecast, and Y-o-Y Growth, 2020-2032,(US$ Bn)
- Others
- Introduction
- Market Size and Forecast, and Y-o-Y Growth, 2020-2032,(US$ Bn)
7. Global Nuclear Imaging Equipment Market, By End User, 2020-2032, (US$ Bn)
- Introduction
- Market Share Analysis, 2025and 2032 (%)
- Y-o-Y Growth Analysis, 2021- 2032
- Segment Trends
- Hospitals and clinics
- Introduction
- Market Size and Forecast, and Y-o-Y Growth, 2020-2032,(US$ Mn)
- Diagnostic imaging centers
- Introduction
- Market Size and Forecast, and Y-o-Y Growth, 2020-2032,(US$ Mn)
- Research institutes
- Introduction
- Market Size and Forecast, and Y-o-Y Growth, 2020-2032,(US$ Mn)
- Others
- Introduction
- Market Size and Forecast, and Y-o-Y Growth, 2020-2032,(US$ Mn)
8. Global Nuclear Imaging Equipment Market, By Region, 2020-2032, (US$ Bn)
- Introduction
- Market Share Analysis, By Region, 2025and 2032 (%)
- Y-o-Y Growth Analysis, For Region, 2021-2032
- Country Trends
- North America
- Introduction
- Market Size and Forecast, and Y-o-Y Growth, By Product Type, 2020-2032,(US$ Bn)
- Market Size and Forecast, and Y-o-Y Growth, By Application, 2020-2032,(US$ Bn)
- Market Size and Forecast, and Y-o-Y Growth, By End User, 2020-2032,(US$ Bn)
- Market Size and Forecast, and Y-o-Y Growth, By Country, 2020-2032,(US$ Bn)
- U.S.
- Canada
- Europe
- Introduction
- Market Size and Forecast, and Y-o-Y Growth, By Product Type, 2020-2032,(US$ Bn)
- Market Size and Forecast, and Y-o-Y Growth, By Application, 2020-2032,(US$ Bn)
- Market Size and Forecast, and Y-o-Y Growth, By End User, 2020-2032,(US$ Bn)
- Market Size and Forecast, and Y-o-Y Growth, By Country, 2020-2032,(US$ Bn)
- U.K.
- Germany
- France
- Italy
- Spain
- Russia
- Rest of Europe
- Asia Pacific
- Introduction
- Market Size and Forecast, and Y-o-Y Growth, By Product Type, 2020-2032,(US$ Bn)
- Market Size and Forecast, and Y-o-Y Growth, By Application, 2020-2032,(US$ Bn)
- Market Size and Forecast, and Y-o-Y Growth, By End User, 2020-2032,(US$ Bn)
- Market Size and Forecast, and Y-o-Y Growth, By Country, 2020-2032,(US$ Bn)
- China
- Japan
- India
- Australia
- ASEAN
- South Korea
- Rest of Asia Pacific
- Latin America
- Introduction
- Market Size and Forecast, and Y-o-Y Growth, By Product Type, 2020-2032,(US$ Bn)
- Market Size and Forecast, and Y-o-Y Growth, By Application, 2020-2032,(US$ Bn)
- Market Size and Forecast, and Y-o-Y Growth, By End User, 2020-2032,(US$ Bn)
- Market Size and Forecast, and Y-o-Y Growth, By Country, 2020-2032,(US$ Bn)
- Brazil
- Mexico
- Argentina
- Rest of Latin America
- Middle East
- Introduction
- Market Size and Forecast, and Y-o-Y Growth, By Product Type, 2020-2032,(US$ Bn)
- Market Size and Forecast, and Y-o-Y Growth, By Application, 2020-2032,(US$ Bn)
- Market Size and Forecast, and Y-o-Y Growth, By End User, 2020-2032,(US$ Bn)
- Market Size and Forecast, and Y-o-Y Growth, By Country, 2020-2032,(US$ Bn)
- GCC Countries
- Israel
- Rest of Middle East
- Africa
- Introduction
- Market Size and Forecast, and Y-o-Y Growth, By Product Type, 2020-2032,(US$ Bn)
- Market Size and Forecast, and Y-o-Y Growth, By Application, 2020-2032,(US$ Bn)
- Market Size and Forecast, and Y-o-Y Growth, By End User, 2020-2032,(US$ Bn)
- Market Size and Forecast, and Y-o-Y Growth, By Country/Region, 2020-2032,(US$ Bn)
- South Africa
- North Africa
- Central Africa
9. Competitive Landscape
- Company Profile
- GE Healthcare
- Company Highlights
- Product Portfolio
- Key Developments
- Financial Performance
- Strategies
- Siemens Healthineers
- Company Highlights
- Product Portfolio
- Key Highlights
- Financial Performance
- Strategies
- Philips Healthcare
- Company Highlights
- Product Portfolio
- Key Highlights
- Financial Performance
- Strategies
- Canon Medical Systems
- Company Highlights
- Product Portfolio
- Key Highlights
- Financial Performance
- Strategies
- Mediso Medical Imaging Systems
- Company Highlights
- Product Portfolio
- Key Highlights
- Financial Performance
- Strategies
- MIE America
- Company Highlights
- Product Portfolio
- Key Highlights
- Financial Performance
- Strategies
- DDD Diagnostic
- Company Highlights
- Product Portfolio
- Key Highlights
- Financial Performance
- Strategies
- Segami
- Company Highlights
- Product Portfolio
- Key Highlights
- Financial Performance
- Strategies
- Digirad
- Company Highlights
- Product Portfolio
- Key Highlights
- Financial Performance
- Strategies
- Analyst Views
10. Section
- References
- Research Methodology
- About us