|
시장보고서
상품코드
1708767
아시네토박터 폐렴 치료제 시장 : 약물 종류별, 투여 경로별, 지역별Global Acinetobacter Pneumonia Therapeutics Market, By Drug Class, By Route of Administration, By Geography |
||||||
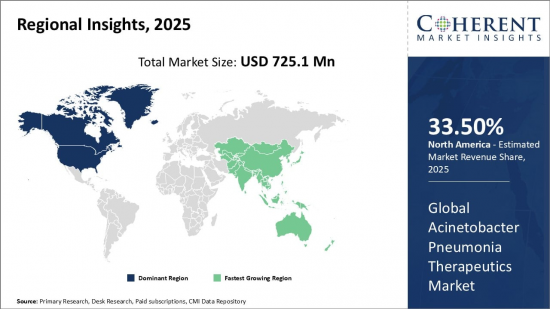
아세토박터 폐렴 치료제 세계 시장 규모는 2025년에 7억 2,510만 달러로 추정되며, 2032년에는 10억 7,600만 달러에 달할 것으로 예상되며, 2025년부터 2032년까지 5.8%의 연평균 성장률(CAGR)을 기록할 것으로 예상됩니다.
| 보고서 범위 | 보고서 상세 | ||
|---|---|---|---|
| 기준 연도 | 2024년 | 2025년 시장 규모 | 7억 2,510만 달러 |
| 실적 데이터 | 2020-2024년 | 예측 기간 | 2025-2032년 |
| 예측 기간 : 2025-2032년 CAGR | 5.80% | 2032년 금액 예측 | 10억 7,600만 달러 |
아시네토박터 폐렴은 아시네토박터 속 박테리아에 의해 발생하는 심각한 폐렴입니다. 이 박테리아는 일반적으로 토양과 물에 존재합니다. 최근에는 다제내성 아시네토박터 균주에 의한 병원 내 폐렴 사례가 급증하고 있습니다. 일반적으로 면역력이 약한 환자나 중환자실에서 인공호흡을 하고 있는 환자들이 감염되기 쉽습니다. 아시네토박터 폐렴의 치료에서 항생제 내성이 가장 큰 문제입니다. 이 병원체를 표적으로 하는 새로운 치료 접근법이 시대적 요청이 되고 있습니다.
시장 역학
세계 아시네토박터 폐렴 치료제 시장은 약제 내성 균주의 확산과 병원 내 폐렴 또는 인공호흡기 관련 폐렴의 발생률 증가에 의해 주도되고 있습니다. 미국 질병관리본부에 따르면, 미국 내 병원 내 폐렴의 8-10%는 매년 아시네토박터 감염에 의해 발생합니다. 또한, 항균제 파이프라인이 제한적이고, 아세트박터 폐렴에 특화된 치료제가 승인되지 않은 것도 이 시장의 비즈니스 기회로 작용하고 있습니다. 그러나 높은 개발 비용과 신약 승인에 따른 규제 장벽이 시장 성장의 걸림돌로 작용하고 있습니다. 이 시장은 다제내성균의 증가, 진단 기술의 발전, 효과적인 치료 옵션의 필요성 등의 요인에 영향을 받고 있습니다. 제약사, 연구기관, 의료 서비스 제공자 간의 협력은 치료 솔루션의 발전에 중요한 역할을 하고 있습니다. 진화하는 감염병 상황과 COVID-19 팬데믹의 영향은 혁신적인 치료 중재와 공중보건 조치를 통해 아시네토박터 폐렴에 대응하기 위한 지속적인 노력의 중요성을 강조하고 있습니다.
본 조사의 주요 특징
세계의 아시네토박터 폐렴 치료제 시장을 상세히 분석했으며, 2024년을 기준 연도로 하여 예측 기간(2025-2032년)의 시장 규모와 CAGR을 조사하여 전해드립니다.
또한, 다양한 부문에 걸친 잠재적인 수익 성장 기회를 밝히고, 이 시장의 매력적인 투자 제안 매트릭스를 설명합니다.
또한 시장 촉진요인, 억제요인, 기회, 신제품 출시 및 승인, 시장 동향, 지역별 전망, 주요 기업의 경쟁 전략 등에 대한 주요 인사이트를 제공합니다.
세계 아시네토박터 폐렴 치료제 시장의 주요 기업 프로파일을 회사 개요, 제품 포트폴리오, 주요 특징, 주요 성과, 전략 등의 매개변수를 기반으로 정리하여 수록하였습니다.
주요 기업으로는 Pfizer, Merck, GlaxoSmithKline(GSK), AstraZeneca, Novartis, Johnson & Johnson, Sanofi, Bayer, Basilea Pharmaceutica 등이 있습니다.
이 보고서의 인사이트를 통해 마케팅 담당자와 기업 경영진은 향후 제품 출시, 유형화, 시장 확대, 마케팅 전략에 대한 정보에 입각한 의사결정을 내릴 수 있습니다.
세계 아세토박터 폐렴 치료제 시장 보고서는 투자자, 공급업체, 제품 제조업체, 유통업체, 신규 진입자, 재무 분석가 등 이 산업의 다양한 이해관계자를 대상으로 합니다.
이해관계자들은 세계 아시네토박터 폐렴 치료제 시장 분석에 사용되는 다양한 전략 매트릭스를 통해 의사결정을 쉽게 내릴 수 있습니다.
목차
제1장 조사 목적과 가정
- 조사 목적
- 가정
- 약어
제2장 시장 전망
- 보고서 설명
- 시장 정의와 범위
- 주요 요약
- Coherent Opportunity Map(COM)
제3장 시장 역학, 규제, 동향 분석
- 시장 역학
- 영향 분석
- 규제 시나리오
- 서비스 제공 포트폴리오
- PEST 분석
- Porters 분석
- 인수합병 시나리오
- 파이프라인 분석
제4장 세계의 아시네토박터 폐렴 치료제 시장 - 코로나바이러스(COVID-19) 팬데믹의 영향
- COVID-19 역학
- 공급측과 수요측 분석
- 경제에 대한 영향
제5장 세계의 아시네토박터 폐렴 치료제 시장, 약물 종류별, 2020-2032년
- 소개
- 세팔로스포린
- 카바페넴
- 아미노글리코사이드
- 폴리믹신
제6장 아시네토박터 폐렴 치료제 세계 시장, 투여 경로별, 2020-2032년
- 소개
- 경구
- 정맥내
- 기타
제7장 세계의 아시네토박터 폐렴 치료제 시장, 지역별, 2020-2032년
- 소개
- 북미
- 유럽
- 아시아태평양
- 라틴아메리카
- 중동
- 아프리카
제8장 경쟁 구도
- Pfizer Inc.
- Merck & Co., Inc.
- GlaxoSmithKline plc(GSK)
- AstraZeneca plc
- Novartis AG
- Johnson & Johnson
- Sanofi S.A.
- Bayer AG
- Basilea Pharmaceutica
제9장 섹션
- 조사 방법
- 출판사 소개
Global Acinetobacter Pneumonia Therapeutics Market is estimated to be valued at USD 725.1 Mn in 2025 and is expected to reach USD 1,076. Mn by 2032, growing at a compound annual growth rate (CAGR) of 5.8% from 2025 to 2032.
| Report Coverage | Report Details | ||
|---|---|---|---|
| Base Year: | 2024 | Market Size in 2025: | USD 725.1 Mn |
| Historical Data for: | 2020 To 2024 | Forecast Period: | 2025 To 2032 |
| Forecast Period 2025 to 2032 CAGR: | 5.80% | 2032 Value Projection: | USD 1,076. Mn |

Acinetobacter pneumonia is a severe type of pneumonia caused by the Acinetobacter species of bacteria. These bacteria are commonly found in soil and water. In recent times, there has been a steep rise in the number of cases of hospital-acquired pneumonia caused by multidrug-resistant Acinetobacter strains. Typically, it affects immunocompromised patients or those on mechanical ventilation in intensive care units. Antibiotic resistance has emerged as a major challenge in treating Acinetobacter pneumonia. Novel therapeutic approaches targeting this pathogen are the need of the hour.
Market Dynamics:
The global Acinetobacter pneumonia therapeutics market is driven by the growing prevalence of drug-resistant strains and increasing incidence of hospital-acquired or ventilator-associated pneumonia. According to the Centers for Disease Control and Prevention, Acinetobacter infections account for 8-10% of all hospital-acquired pneumonia cases in the U.S. every year. Moreover, the restricted antibacterial pipeline and lack of approved therapies specific to Acinetobacter pneumonia act as opportunities in the market. However, high development costs and regulatory hurdles associated with new drug approvals hamper the market growth. The market is influenced by factors such as increasing incidence of multidrug-resistant strains, advancements in diagnostic technologies, and the need for effective treatment options. Collaborations between pharmaceutical companies, research institutions, and healthcare providers play a crucial role in advancing therapeutic solutions. The evolving landscape of infectious diseases and the impact of the COVID-19 pandemic underscore the importance of sustained efforts to address Acinetobacter pneumonia through innovative therapeutic interventions and public health measures.
Key Features of the Study:
This report provides an in-depth analysis of the global acinetobacter pneumonia therapeutics market, and provides market size (US$ Million) and compound annual growth rate (CAGR %) for the forecast period (2025-2032), considering 2024 as the base year
It elucidates potential revenue growth opportunities across different segments and explains attractive investment proposition matrices for this market
This study also provides key insights about market drivers, restraints, opportunities, new product launches or approvals, market trends, regional outlook, and competitive strategies adopted by key players
It profiles key players in the global acinetobacter pneumonia therapeutics market based on the following parameters - company highlights, products portfolio, key highlights, financial performance, and strategies
Key companies covered as a part of this study include Pfizer Inc., Merck & Co., Inc., GlaxoSmithKline plc (GSK), AstraZeneca plc, Novartis AG, Johnson & Johnson, Sanofi S.A., Bayer AG, and Basilea Pharmaceutica
Insights from this report would allow marketers and the management authorities of the companies to make informed decisions regarding their future product launches, type up-gradation, market expansion, and marketing tactics
The global acinetobacter pneumonia therapeutics market report caters to various stakeholders in this industry including investors, suppliers, product manufacturers, distributors, new entrants, and financial analysts
Stakeholders would have ease in decision-making through various strategy matrices used in analyzing the global acinetobacter pneumonia therapeutics market.
Detailed Segmentation:
- Global Acinetobacter Pneumonia Therapeutics Market, By Drug Class
- Cephalosporins
- Carbapenems
- Aminoglycosides
- Polymyxins
- Global Acinetobacter Pneumonia Therapeutics Market, By Route of Administration
- Oral
- Intravenous
- Others
- Global Acinetobacter Pneumonia Therapeutics Market, By Region
- North America
- Europe
- Asia Pacific
- Latin America
- Middle East
- Africa
- Company Profiles
- Pfizer Inc.
- Merck & Co., Inc.
- GlaxoSmithKline plc (GSK)
- AstraZeneca plc
- Novartis AG
- Johnson & Johnson
- Sanofi S.A.
- Bayer AG
- Basilea Pharmaceutica
Table of Contents
1. Research Objectives and Assumptions
- Research Objectives
- Assumptions
- Abbreviations
2. Market Purview
- Report Description
- Market Definition and Scope
- Executive Summary
- Global Acinetobacter Pneumonia Therapeutics Market, By Drug Class
- Global Acinetobacter Pneumonia Therapeutics Market, By Route of Administration
- Global Acinetobacter Pneumonia Therapeutics Market, By Region
- Coherent Opportunity Map (COM)
3. Market Dynamics, Regulations, and Trends Analysis
- Market Dynamics
- Rising prevalence of Acinetobacter pneumonia infections
- Increasing research & development activities
- Growing healthcare expenditure
- Impact Analysis
- Key Highlights
- Regulatory Scenario
- Service offering Portfolio
- PEST Analysis
- PORTER's Analysis
- Merger and Acquisition Scenario
- Pipeline Analysis
4. Global Acinetobacter Pneumonia Therapeutics Market - Impact of Coronavirus (COVID-19) Pandemic
- COVID-19 Epidemiology
- Supply Side and Demand Side Analysis
- Economic Impact
5. Global Acinetobacter Pneumonia Therapeutics Market, By Drug Class, 2020-2032, (US$ Mn)
- Introduction
- Market Share Analysis, 2025 and 2032 (%)
- Y-o-Y Growth Analysis, 2021 - 2032
- Segment Trends
- Cephalosporins
- Introduction
- Market Size and Forecast, and Y-o-Y Growth, 2020-2032,(US$ Mn)
- Carbapenems
- Introduction
- Market Size and Forecast, and Y-o-Y Growth, 2020-2032,(US$ Mn)
- Aminoglycosides
- Introduction
- Market Size and Forecast, and Y-o-Y Growth, 2020-2032,(US$ Mn)
- Polymyxins
- Introduction
- Market Size and Forecast, and Y-o-Y Growth, 2020-2032,(US$ Mn)
6. Global Acinetobacter Pneumonia Therapeutics Market, By Route of Administration, 2020-2032, (US$ Mn)
- Introduction
- Market Share Analysis, 2025 and 2032 (%)
- Y-o-Y Growth Analysis, 2021 - 2032
- Segment Trends
- Oral
- Introduction
- Market Size and Forecast, and Y-o-Y Growth, 2020-2032,(US$ Mn)
- Intravenous
- Introduction
- Market Size and Forecast, and Y-o-Y Growth, 2020-2032,(US$ Mn)
- Others
- Introduction
- Market Size and Forecast, and Y-o-Y Growth, 2020-2032,(US$ Mn)
7. Global Acinetobacter Pneumonia Therapeutics Market, By Region, 2020-2032, (US$ Mn)
- Introduction
- Market Share Analysis, By Region, 2025 and 2032 (%)
- Y-o-Y Growth Analysis, For Region, 2021 - 2032
- Country Trends
- North America
- Introduction
- Market Size and Forecast, and Y-o-Y Growth, By Drug Class, 2020-2032,(US$ Mn)
- Market Size and Forecast, and Y-o-Y Growth, By Route of Administration, 2020-2032,(US$ Mn)
- Market Size and Forecast, and Y-o-Y Growth, By Country, 2020-2032,(US$ Mn)
- U.S.
- Canada
- Europe
- Introduction
- Market Size and Forecast, and Y-o-Y Growth, By Drug Class, 2020-2032,(US$ Mn)
- Market Size and Forecast, and Y-o-Y Growth, By Route of Administration, 2020-2032,(US$ Mn)
- Market Size and Forecast, and Y-o-Y Growth, By Country, 2020-2032,(US$ Mn)
- Germany
- U.K.
- Spain
- France
- Italy
- Russia
- Rest of Europe
- Asia Pacific
- Introduction
- Market Size and Forecast, and Y-o-Y Growth, By Drug Class, 2020-2032,(US$ Mn)
- Market Size and Forecast, and Y-o-Y Growth, By Route of Administration, 2020-2032,(US$ Mn)
- Market Size and Forecast, and Y-o-Y Growth, By Country, 2020-2032,(US$ Mn)
- China
- India
- Japan
- Australia
- South Korea
- ASEAN
- Rest of Asia Pacific
- Latin America
- Introduction
- Market Size and Forecast, and Y-o-Y Growth, By Drug Class, 2020-2032,(US$ Mn)
- Market Size and Forecast, and Y-o-Y Growth, By Route of Administration, 2020-2032,(US$ Mn)
- Market Size and Forecast, and Y-o-Y Growth, By Country, 2020-2032,(US$ Mn)
- Brazil
- Argentina
- Mexico
- Rest of Latin America
- Middle East
- Introduction
- Market Size and Forecast, and Y-o-Y Growth, By Drug Class, 2020-2032,(US$ Mn)
- Market Size and Forecast, and Y-o-Y Growth, By Route of Administration, 2020-2032,(US$ Mn)
- Market Size and Forecast, and Y-o-Y Growth, By Country, 2020-2032,(US$ Mn)
- GCC Countries
- Israel
- Rest of Middle East
- Africa
- Introduction
- Market Size and Forecast, and Y-o-Y Growth, By Drug Class, 2020-2032,(US$ Mn)
- Market Size and Forecast, and Y-o-Y Growth, By Route of Administration, 2020-2032,(US$ Mn)
- Market Size and Forecast, and Y-o-Y Growth, By Country/Sub-region, 2020-2032,(US$ Mn)
- North Africa
- Central Africa
- South Africa
8. Competitive Landscape
- Pfizer Inc.
- Company Highlights
- Drug Class Portfolio
- Key Highlights
- Financial Performance
- Strategies
- Merck & Co., Inc.
- Company Highlights
- Drug Class Portfolio
- Key Highlights
- Financial Performance
- Strategies
- GlaxoSmithKline plc (GSK)
- Company Highlights
- Drug Class Portfolio
- Key Highlights
- Financial Performance
- Strategies
- AstraZeneca plc
- Company Highlights
- Drug Class Portfolio
- Key Highlights
- Financial Performance
- Strategies
- Novartis AG
- Company Highlights
- Drug Class Portfolio
- Key Highlights
- Financial Performance
- Strategies
- Johnson & Johnson
- Company Highlights
- Drug Class Portfolio
- Key Highlights
- Financial Performance
- Strategies
- Sanofi S.A.
- Company Highlights
- Drug Class Portfolio
- Key Highlights
- Financial Performance
- Strategies
- Bayer AG
- Company Highlights
- Drug Class Portfolio
- Key Highlights
- Financial Performance
- Strategies
- Basilea Pharmaceutica
- Company Highlights
- Drug Class Portfolio
- Key Highlights
- Financial Performance
- Strategies
- Analyst Views
9. Section
- Research Methodology
- About us