


|
시장보고서
상품코드
1708614
원유 운송 시장 : 운송 유형별, 서비스별, 원유종류별, 지역별Crude Transportation Market, By Type of Transportation, By Services, By Oil Type, By Geography |
||||||
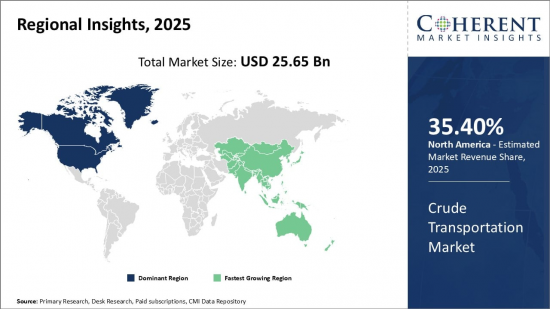
세계 원유 운송 시장은 2025년에 256억 5,000만 달러로 추정되며, 2032년에는 390억 9,000만 달러에 달할 것으로 예상되며, 2025년부터 2032년까지 연평균 성장률(CAGR)은 6.20%에 달할 것으로 예상됩니다.
| 보고서 범위 | 보고서 상세 | ||
|---|---|---|---|
| 기준 연도 | 2024년 | 2025년 시장 규모 | 256억 5,000만 달러 |
| 실적 데이터 | 2020-2024년 | 예측 기간 | 2025-2032년 |
| 예측 기간 : 2025-2032년 CAGR | 6.20% | 2032년 금액 예측 | 390억 9,000만 달러 |
원유 운송은 세계 에너지 산업에서 중요한 역할을 담당하고 있으며, 생산 현장에서 정제소, 최종 소비자에게 원유를 이동시키는데 중요한 역할을 하고 있습니다. 이 과정에는 파이프라인, 유조선, 철도차량, 트럭 등 다양한 운송 수단을 통한 원유 수송이 포함됩니다. 원유의 효율적이고 안전한 운송은 에너지 수요를 충족시키고 전 세계 석유 제품의 안정적인 공급을 보장하는 데 있어 매우 중요합니다. 운송 인프라와 물류의 발전으로 석유 산업은 원유를 먼 거리까지 효율적으로 운송하고 산유 지역과 정유소 및 시장을 연결할 수 있게 되었습니다.
시장 역학
세계 에너지 수요, 석유 매장량의 지리적 분포는 예측 기간 동안 세계 원유 운송 시장의 성장을 촉진할 것으로 예상됩니다. 또한, 채굴 기술의 발전, 정치적 및 경제적 안정도 예측 기간 동안 세계 원유 운송 시장의 성장을 촉진할 것으로 예상됩니다. 신흥 경제국, 기술 발전, 인프라 개발, 에너지 믹스의 다양화는 예측 기간 동안 세계 원유 운송 시장에 성장 기회를 제공할 것으로 예상됩니다.
그러나 규제 장벽, 대중의 반대, 지정학적 불안정성은 예측 기간 동안 원유 운송 시장의 성장을 저해할 것으로 예상됩니다.
본 조사의 주요 특징
- 세계의 원유 수송 시장을 상세히 분석하여 2024년을 기준 연도로 하여 예측 기간(2025-2032년)의 시장 규모와 연평균 성장률(CAGR)을 조사 분석하여 전해드립니다.
- 또한, 다양한 부문에 걸친 잠재적 수익 기회를 밝히고, 이 시장의 매력적인 투자 제안 매트릭스를 설명합니다.
- 또한 시장 촉진요인, 억제요인, 기회, 신제품 출시 및 승인, 시장 동향, 지역별 전망, 주요 기업의 경쟁 전략 등에 대한 주요 인사이트를 제공합니다.
- 기업 하이라이트, 제품 포트폴리오, 주요 하이라이트, 재무 실적, 전략 등의 매개 변수를 기반으로 원유 운송 시장의 주요 기업 프로파일을 제공합니다.
- 이 보고서의 인사이트를 통해 마케팅 담당자와 기업 경영진은 향후 제품 출시, 유형 업그레이드, 시장 확대, 마케팅 전술에 대한 정보에 입각한 의사결정을 내릴 수 있습니다.
- 이 보고서는 투자자, 공급업체, 제품 제조업체, 유통업체, 신규 진입자, 재무 분석가 등 이 산업의 다양한 이해관계자를 대상으로 합니다.
- 이해관계자들은 원유 운송 시장 분석에 사용되는 다양한 전략 매트릭스를 통해 의사결정을 쉽게 내릴 수 있습니다.
목차
제1장 조사 목적과 가정
- 조사 목적
- 가정
- 약어
제2장 시장 전망
- 보고서 설명
- 시장 정의와 범위
- 주요 요약
- Coherent Opportunity Map(COM)
제3장 시장 역학, 규제, 동향 분석
- 시장 역학
- 세계의 에너지 수요
- 석유 매장량 지역적 분포
- 추출 기술의 진보
- 규제상 장벽
- 국민 반대
- 지정학적 불안정성
- 신흥 경제국
- 기술의 진보
- 인프라 개발
- 규제 시나리오
- 제품 발매/승인
- PEST 분석
- Porters 분석
- 합병, 인수, 협업
제4장 원유 운송 시장 - 코로나바이러스(COVID-19) 팬데믹의 영향
- COVID-19 역학
- 공급측과 수요측 분석
- 경제에 대한 영향
제5장 원유 운송 시장, 운송 형태별, 2020-2032년
- 소개
- 파이프라인
- 탱커와 바지선
- 트럭
- 철도
제6장 원유 운송 시장, 서비스별, 2020-2032년
- 소개
- 운송과 보관
- 부대 서비스
제7장 원유 운송 시장, 원유종류별, 2020-2032년
- 소개
- 원유
- 정제 제품
제8장 원유 운송 시장, 지역별, 2020-2032년
- 소개
- 북미
- 유럽
- 아시아태평양
- 라틴아메리카
- 중동 및 아프리카
제9장 경쟁 구도
- 기업 개요
- ExxonMobil Corporation
- Royal Dutch Shell
- Chevron Corporation
- BP plc.
- TotalEnergies SE
- ConocoPhillips
- China National Petroleum Corporation
- Saudi Aramco
- Rosneft Oil Company
- Valero Energy Corporation
- Phillips 66
- Marathon Petroleum Corporation
- PetroChina Company Limited
- Kinder Morgan, Inc.
- Enbridge Inc.
제10장 섹션
- 참고문헌
- 조사 방법
- 출판사 소개
Global Crude Transportation Market is estimated to be valued at USD 25.65 Bn in 2025 and is expected to reach USD 39.09 Bn by 2032, growing at a compound annual growth rate (CAGR) of 6.20% from 2025 to 2032.
| Report Coverage | Report Details | ||
|---|---|---|---|
| Base Year: | 2024 | Market Size in 2025: | USD 25.65 Bn |
| Historical Data for: | 2020 To 2024 | Forecast Period: | 2025 To 2032 |
| Forecast Period 2025 to 2032 CAGR: | 6.20% | 2032 Value Projection: | USD 39.09 Bn |

Crude transportation plays a vital role in the global energy industry, facilitating the movement of crude oil from production sites to refineries and end consumers. This process involves the transportation of unrefined petroleum through various modes, including pipelines, tankers, railcars, and trucks. The efficient and safe transportation of crude oil is crucial to meet energy demands and ensure a steady supply of petroleum products worldwide. Advances in transportation infrastructure and logistics have enabled the industry to efficiently transport crude oil across vast distances, thereby connecting oil producing regions with refineries and markets.
Market Dynamics:
Global energy demand, and geographical distribution of oil reserves is anticipated to drive growth of the global crude transportation market over the forecast period. Moreover, advancements in extraction technologies, political, and economic stability is also expected to boost the growth of the global crude transportation market over the forecast period. Emerging economies, technological advancements, infrastructure development, and diversification of energy mix are expected to create growth opportunities for the global crude transportation market during the forecast period.
However, regulatory barriers, public opposition, and geopolitical instability are expected to hamper growth of the crude transportation market over the forecast period.
Key features of the study:
- This report provides in-depth analysis of the crude transportation market, and provides market size (US$ Bn) and compound annual growth rate (CAGR %) for the forecast period (2025-2032), considering 2024 as the base year.
- It elucidates potential revenue opportunities across different segments and explains attractive investment proposition matrices for this market.
- This study also provides key insights about market drivers, restraints, opportunities, new product launches or approval, market trends, regional outlook, and competitive strategies adopted by key players.
- It profiles key players in the crude transportation market based on the following parameters - company highlights, products portfolio, key highlights, financial performance, and strategies.
- Key companies covered as a part of this study include ExxonMobil Corporation, Royal Dutch Shell, Chevron Corporation, BP plc, Total Energies SE, ConocoPhillips, China National Petroleum Corporation, Saudi Aramco, Rosneft Oil Company, Valero Energy Corporation, Phillips 66, Marathon Petroleum Corporation, PetroChina Company Limited, Kinder Morgan, Inc., and Enbridge Inc.
- Insights from this report would allow marketers and the management authorities of the companies to make informed decisions regarding their future product launches, type up-gradation, market expansion, and marketing tactics.
- The crude transportation market report caters to various stakeholders in this industry including investors, suppliers, product manufacturers, distributors, new entrants, and financial analysts.
- Stakeholders would have ease in decision-making through various strategy matrices used in analyzing the crude transportation market.
Detailed Segmentation:
- Crude Transportation Market, By Type of Transportation:
- Pipelines
- Tanker and Barges
- Truck
- Rail
- Crude Transportation Market, By Services:
- Transportation & Storage
- Ancillary Services
- Crude Transportation Market, By Oil Type:
- Crude Oil
- Refined Products
- Crude Transportation Market, By Region:
- North America
- Europe
- Asia Pacific
- Latin America
- Middle East
- Africa
- Company Profiles
- ExxonMobil Corporation
- Royal Dutch Shell
- Chevron Corporation
- BP plc
- TotalEnergies SE
- ConocoPhillips
- China National Petroleum Corporation
- Saudi Aramco
- Rosneft Oil Company
- Valero Energy Corporation
- Phillips 66
- Marathon Petroleum Corporation
- PetroChina Company Limited
- Kinder Morgan, Inc.
- Enbridge Inc.
Table of Contents
1. Research Objectives and Assumptions
- Research Objectives
- Assumptions
- Abbreviations
2. Market Purview
- Report Description
- Market Definition and Scope
- Executive Summary
- Crude Transportation Market, By Type of Transportation
- Crude Transportation Market, By Services
- Crude Transportation Market, By Oil Type
- Crude Transportation Market, By Region
- Coherent Opportunity Map (COM)
3. Market Dynamics, Regulations, and Trends Analysis
- Market Dynamics
- Drivers
- Global energy demand
- Geographical distribution of oil reserves
- Advancements in extraction technologies
- Restraints
- Regulatory barriers
- Public opposition
- Geopolitical instability
- Opportunities
- Emerging economies
- Technological advancements
- Infrastructure development
- Key Highlights
- Regulatory Scenario
- Recent Trends
- Product Launches/Approvals
- PEST Analysis
- PORTER's Analysis
- Mergers, Acquisitions. and Collaborations
4. Crude Transportation Market - Impact of Coronavirus (COVID-19) Pandemic
- COVID-19 Epidemiology
- Supply Side and Demand Side Analysis
- Economic Impact
5. Crude Transportation Market, By Type of Transportation, 2020-2032, (US$ Bn)
- Introduction
- Market Share Analysis, 2025 and 2032 (%)
- Y-o-Y Growth Analysis, 2021 - 2032
- Segment Trends
- Pipelines
- Introduction
- Market Size and Forecast, and Y-o-Y Growth, 2020-2032, (US$ Bn)
- Tanker and Barges
- Introduction
- Market Size and Forecast, and Y-o-Y Growth, 2020-2032, (US$ Bn)
- Truck
- Introduction
- Market Size and Forecast, and Y-o-Y Growth, 2020-2032, (US$ Bn)
- Rail
- Introduction
- Market Size and Forecast, and Y-o-Y Growth, 2020-2032, (US$ Bn)
6. Crude Transportation Market, By Services, 2020-2032, (US$ Bn)
- Introduction
- Market Share Analysis, 2025 and 2032 (%)
- Y-o-Y Growth Analysis, 2021 - 2032
- Segment Trends
- Transportation & Storage
- Introduction
- Market Size and Forecast, and Y-o-Y Growth, 2020-2032, (US$ Bn)
- Ancillary Services
- Introduction
- Market Size and Forecast, and Y-o-Y Growth, 2020-2032, (US$ Bn)
7. Crude Transportation Market, By Oil Type, 2020-2032, (US$ Bn)
- Introduction
- Market Share Analysis, 2025 and 2032 (%)
- Y-o-Y Growth Analysis, 2021 - 2032
- Segment Trends
- Crude Oil
- Introduction
- Market Size and Forecast, and Y-o-Y Growth, 2020-2032, (US$ Bn)
- Refined Products
- Introduction
- Market Size and Forecast, and Y-o-Y Growth, 2020-2032, (US$ Bn)
8. Crude Transportation Market, By Region, 2020-2032, (US$ Bn)
- Introduction
- Market Share Analysis, By Sub-region, 2025 and 2032 (%)
- Y-o-Y Growth Analysis, For Sub-region, 2021 -2032
- Country Trends
- North America
- Introduction
- Market Size and Forecast, and Y-o-Y Growth, By Type of Transportation, 2020-2032, (US$ Bn)
- Market Size and Forecast, and Y-o-Y Growth, By Services, 2020-2032, (US$ Bn)
- Market Size and Forecast, and Y-o-Y Growth, By Oil Type, 2020-2032, (US$ Bn)
- Market Size and Forecast, and Y-o-Y Growth, By Country, 2020-2032, (US$ Bn)
- U.S.
- Canada
- Europe
- Introduction
- Market Size and Forecast, and Y-o-Y Growth, By Type of Transportation, 2020-2032, (US$ Bn)
- Market Size and Forecast, and Y-o-Y Growth, By Services, 2020-2032, (US$ Bn)
- Market Size and Forecast, and Y-o-Y Growth, By Oil Type, 2020-2032, (US$ Bn)
- Market Size and Forecast, and Y-o-Y Growth, By Country, 2020-2032, (US$ Bn)
- Germany
- U.K.
- France
- Russia
- Italy
- Spain
- Rest of Europe
- Asia Pacific
- Introduction
- Market Size and Forecast, and Y-o-Y Growth, By Type of Transportation, 2020-2032, (US$ Bn)
- Market Size and Forecast, and Y-o-Y Growth, By Services, 2020-2032, (US$ Bn)
- Market Size and Forecast, and Y-o-Y Growth, By Oil Type, 2020-2032, (US$ Bn)
- Market Size and Forecast, and Y-o-Y Growth, By Country, 2020-2032, (US$ Bn)
- China
- India
- Japan
- Australia
- South Korea
- ASEAN
- Rest of Asia Pacific
- Latin America
- Introduction
- Market Size and Forecast, and Y-o-Y Growth, By Type of Transportation, 2020-2032, (US$ Bn)
- Market Size and Forecast, and Y-o-Y Growth, By Services, 2020-2032, (US$ Bn)
- Market Size and Forecast, and Y-o-Y Growth, By Oil Type, 2020-2032, (US$ Bn)
- Market Size and Forecast, and Y-o-Y Growth, By Country, 2020-2032, (US$ Bn)
- Brazil
- Argentina
- Mexico
- Rest of Latin America
- Middle East & Africa
- Introduction
- Market Size and Forecast, and Y-o-Y Growth, By Type of Transportation, 2020-2032, (US$ Bn)
- Market Size and Forecast, and Y-o-Y Growth, By Services, 2020-2032, (US$ Bn)
- Market Size and Forecast, and Y-o-Y Growth, By Oil Type, 2020-2032, (US$ Bn)
- Market Size and Forecast, and Y-o-Y Growth, By Country/Sub-region, 2020-2032, (US$ Bn)
- GCC Countries
- Israel
- South Africa
- Central Africa
- North Africa
- Rest of Middle East
9. Competitive Landscape
- Company Profile
- ExxonMobil Corporation
- Company Highlights
- Product Portfolio
- Key Developments
- Financial Performance
- Strategies
- Royal Dutch Shell
- Company Highlights
- Product Portfolio
- Key Highlights
- Financial Performance
- Strategies
- Chevron Corporation
- Company Highlights
- Product Portfolio
- Key Highlights
- Financial Performance
- Strategies
- BP plc.
- Company Highlights
- Product Portfolio
- Key Highlights
- Financial Performance
- Strategies
- TotalEnergies SE
- Company Highlights
- Product Portfolio
- Key Highlights
- Financial Performance
- Strategies
- ConocoPhillips
- Company Highlights
- Product Portfolio
- Key Highlights
- Financial Performance
- Strategies
- China National Petroleum Corporation
- Company Highlights
- Product Portfolio
- Key Highlights
- Financial Performance
- Strategies
- Saudi Aramco
- Company Highlights
- Product Portfolio
- Key Highlights
- Financial Performance
- Strategies
- Rosneft Oil Company
- Valero Energy Corporation
- Phillips 66
- Marathon Petroleum Corporation
- PetroChina Company Limited
- Kinder Morgan, Inc.
- Enbridge Inc.
- Analyst Views
10. Section
- References
- Research Methodology
- About us


