|
시장보고서
상품코드
1708820
배출권 거래 시장 : 거래 유형별, 최종 용도별, 지역별Emissions Trading Market, By Type Of Trading, By End Use, By Geography |
||||||
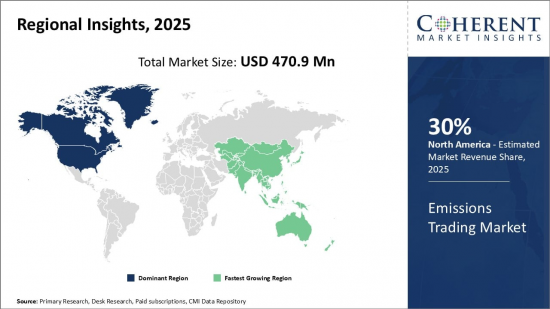
세계 배출권 거래 시장은 2025년 4억 7,090만 달러로 추정되며, 2032년에는 15억 5,410만 달러에 달할 것으로 예상되며, 2025-2032년 CAGR은 18.6%로 성장할 것으로 전망됩니다.
| 보고서 범위 | 보고서 상세 | ||
|---|---|---|---|
| 기준 연도 | 2024년 | 2025년 시장 규모 | 4억 7,090만 달러 |
| 실적 데이터 | 2020-2024년 | 예측 기간 | 2025-2032년 |
| 예측 기간 : 2025-2032년 CAGR | 18.60% | 2032년 금액 예측 | 15억 5,410만 달러 |
배출권 거래제(Cap and Trade)라고도 불리는 배출권 거래는 온실가스 배출을 통제하기 위한 시장 기반 접근 방식입니다. 배출권 거래는 특정 산업이나 지역에서 배출되는 온실가스의 총량을 제한하는 것을 전제로 운영됩니다. 기업에는 허용 배출량에 따라 배출권이 할당됩니다. 기업이 할당된 배출량보다 적게 배출할 경우, 해당 기업은 배출권을 초과하는 다른 기업에 잉여 배출권을 판매할 수 있습니다. 이 제도는 배출량 목표 달성을 위한 유연성을 제공하는 동시에, 기업이 배출량 감축을 위해 노력함으로써 배출량 감축에 대한 인센티브를 제공합니다. 배출권 거래는 기후변화에 대응하고, 산업 간 협력을 촉진하며, 청정기술에 대한 투자를 촉진하는 중요한 수단으로 전 세계적으로 각광받고 있습니다.
배출권 거래 시장은 환경문제에 대한 관심 증가와 기후변화 대응을 위한 국제적인 노력에 힘입어 최근 몇 년 동안 괄목할 만한 성장을 거듭하고 있습니다. 유럽연합(EU), 중국, 미국 일부를 포함한 다양한 지역에서 온실가스 배출을 효과적으로 규제하기 위한 배출권 거래제도가 도입되고 있습니다. 또한, 자발적 탄소 시장이 등장하여 기업이나 개인이 자발적으로 탄소 배출량을 상쇄할 수 있게 되었습니다. 탄소 배출량 감축을 위해 노력하는 국가와 기업이 늘어남에 따라 배출권 거래 시장은 지속적으로 확대될 것이며, 보다 지속가능하고 기후변화에 대응하는 미래로의 전환에 중요한 역할을 할 것으로 예상됩니다.
유럽연합 배출권거래제(EU ETS)는 세계 최대 탄소시장으로 전 세계 탄소배출권 거래량의 약 90%를 차지하고 있으며, EU는 2030년까지 온실가스 배출량을 55% 감축하기로 약속한 만큼 EU ETS는 앞으로도 계속 성장할 것으로 예상됩니다.
시장 역학
환경 문제, 기후 변화 완화, 규제 준수, 국제적인 약속은 예측 기간 동안 세계 배출권 거래 시장의 성장을 촉진할 것으로 예상됩니다. 또한, 경제적 효율성과 비용 효율성, 청정 기술 및 기술 혁신의 촉진도 예측 기간 동안 배출권 거래 시장의 성장을 촉진할 것으로 예상됩니다. 배출권 거래제의 확대, 배출권 거래제의 통합, 새로운 온실가스의 추가, 넷제로 목표를 위한 시장 기반 솔루션은 예측 기간 동안 배출권 거래 시장에 성장 기회를 제공할 것으로 예상됩니다.
그러나 정치적, 정책적 불확실성, 불충분한 엄격성, 시장 조작, 가격 변동성 등이 예측 기간 동안 배출권 거래 시장의 성장을 저해할 것으로 예상됩니다.
본 조사의 주요 특징
- 본 보고서는 배출권 거래 시장을 상세히 분석하여 2024년을 기준 연도로 하여 예측 기간(2025-2032년)의 시장 규모와 연평균 성장률(CAGR)을 조사 분석하여 전해드립니다.
- 또한, 다양한 부문에 걸친 잠재적 수익 기회를 밝히고, 이 시장의 매력적인 투자 제안 매트릭스를 설명합니다.
- 또한 시장 촉진요인, 억제요인, 기회, 신제품 출시 및 승인, 시장 동향, 지역별 전망, 주요 기업의 경쟁 전략 등에 대한 중요한 인사이트를 제공합니다.
- 기업 하이라이트, 제품 포트폴리오, 주요 하이라이트, 재무 실적, 전략 등의 매개 변수를 기반으로 배출권 거래 시장의 주요 기업을 프로파일링합니다.
- 이 보고서는 투자자, 공급업체, 제품 제조업체, 유통업체, 신규 진입자, 재무 분석가 등 이 산업의 다양한 이해관계자를 대상으로 합니다.
- 이해관계자들은 배출권 거래 시장 분석에 사용되는 다양한 전략 매트릭스를 통해 의사결정을 쉽게 할 수 있습니다.
목차
제1장 조사 목적과 가정
- 조사 목적
- 가정
- 약어
제2장 시장 전망
- 보고서 설명
- 시장 정의와 범위
- 주요 요약
- Coherent Opportunity Map(COM)
제3장 시장 역학, 규제, 동향 분석
- 시장 역학
- 환경 문제와 기후변화 완화
- 규제 준수와 국제적약속
- 경제 효율과 비용 효율
- 청정기술과 혁신 촉진
- 대규모 배출국의 대처 부족
- 배출범위 무상 할당 보급
- 탄소 누출 리스크
- 배출량 거래 제도 확대
- 배출량 거래 제도 제휴
- 새로운 온실가스 추가
- 넷제로 목표를 향한 시장 기반 솔루션
- 규제 시나리오
- 제품 발매/승인
- PEST 분석
- Porters 분석
- 합병, 인수, 제휴
제4장 배출량 거래 시장, 거래 유형별, 2020-2032년
- 소개
- 캡 앤드 트레이드
- 베이스라인과 신용
제5장 배출량 거래 시장, 용도별, 2020-2032년
- 소개
- 에너지
- 발전
- 산업
- 운송
- 농업
제6장 배출량 거래 시장, 지역별, 2020-2032년
- 소개
- 북미
- 유럽
- 아시아태평양
- 라틴아메리카
- 중동 및 아프리카
제7장 경쟁 구도
- 기업 개요
- BP Plc.
- Royal Dutch Shell Plc
- Total SE
- Chevron Corporation
- ExxonMobil Corporation
- Engie SA
- RWE AG
- ON SE
- Vattenfall AB
- Gazprom
- Mitsubishi UFJ Financial Group(MUFG)
- JPMorgan Chase & Co.
- Goldman Sachs Group, Inc.
- Citigroup Inc.
- Barclays PLC
제8장 섹션
- 참고문헌
- 조사 방법
- 출판사 소개
Global Emissions Trading Market is estimated to be valued at USD 470.9 Mn in 2025 and is expected to reach USD 1,554.1 Mn by 2032, growing at a compound annual growth rate (CAGR) of 18.6% from 2025 to 2032.
| Report Coverage | Report Details | ||
|---|---|---|---|
| Base Year: | 2024 | Market Size in 2025: | USD 470.9 Mn |
| Historical Data for: | 2020 To 2024 | Forecast Period: | 2025 To 2032 |
| Forecast Period 2025 to 2032 CAGR: | 18.60% | 2032 Value Projection: | USD 1,554.1 Mn |

Emissions trading, also known as cap-and-trade, is a market-based approach to controlling greenhouse gas emissions. It operates under the premise of setting a cap on the total allowable emissions from specific industries or regions. Companies are allocated emission allowances corresponding to their permitted emission levels. If a company emits below its allotted amount, it can sell the surplus allowances to other companies exceeding their emissions limits. This system incentivizes emissions reductions as companies strive to maintain compliance while providing flexibility in achieving emission targets. Emissions trading has gained prominence globally as a crucial tool in addressing climate change, fostering cooperation among industries, and encouraging investment in cleaner technologies.
The emissions trading market has witnessed significant growth in recent years, spurred by mounting environmental concerns and international efforts to combat climate change. Various regions, including the European Union, China, and parts of the U.S., have implemented emissions trading systems to regulate greenhouse gas emissions effectively. Additionally, the voluntary carbon market has emerged, enabling businesses and individuals to offset their carbon footprint voluntarily. As more countries and companies commit to reducing their carbon emissions, the emissions trading market is likely to continue expanding, playing a vital role in the global transition towards a more sustainable and climate-conscious future.
The European Union Emissions Trading System (EU ETS) is the largest carbon market in the world, accounting for around 90% of global carbon credit trading volume. The EU ETS is expected to continue to grow in the coming years, as the European Union commits to reducing its greenhouse gas emissions by 55% by 2030.
Market Dynamics:
Environmental concerns and climate change mitigation, regulatory compliance and international commitments are anticipated to drive growth of the global emissions trading market over the forecast period. Moreover, economic efficiency and cost-effectiveness, stimulating clean technologies and innovation is also expected to boost the growth of the emissions trading market over the forecast period. Expansion of emissions trading schemes, linking emissions trading systems, inclusion of new greenhouse gases, and market-based solutions for net-zero goals are expected to create growth opportunities for the emissions trading market during the forecast period.
However, political and policy uncertainty, insufficient stringency, market manipulation and price volatility are expected to hamper growth of the emissions trading market over the forecast period.
Key features of the study:
- This report provides in-depth analysis of the emissions trading market, and provides market size (US$ Mn) and compound annual growth rate (CAGR %) for the forecast period (2025-2032), considering 2024 as the base year.
- It elucidates potential revenue opportunities across different segments and explains attractive investment proposition matrices for this market.
- This study also provides key insights about market drivers, restraints, opportunities, new product launches or approval, market trends, regional outlook, and competitive strategies adopted by key players.
- It profiles key players in the emissions trading market based on the following parameters - company highlights, products portfolio, key highlights, financial performance, and strategies.
- Key companies covered as a part of this study include BP Plc., Royal Dutch Shell Plc., Total SE, Chevron Corporation, ExxonMobil Corporation, Engie SA, RWE AG, EON SE, Vattenfall AB, Gazprom, Mitsubishi UFJ Financial Group (MUFG), JPMorgan Chase & Co., Goldman Sachs Group, Inc. Citigroup Inc., and Barclays PLC Insights from this report would allow marketers and the management authorities of the companies to make informed decisions regarding their future product launches, type up-gradation, market expansion, and marketing tactics.
- The emissions trading market report caters to various stakeholders in this industry including investors, suppliers, product manufacturers, distributors, new entrants, and financial analysts.
- Stakeholders would have ease in decision-making through various strategy matrices used in analyzing the emissions trading market.
Detailed Segmentation:
- Emissions Trading Market Segmentation, By Trading Type:
- Cap-and-Trade
- Baseline-and-Credit
- Emissions Trading Market Segmentation, By End Use:
- Energy
- Power Generation
- Industrial
- Transportation
- Agriculture
- Emissions Trading Market Segmentation, By Region:
- North America
- Europe
- Asia Pacific
- Latin America
- Middle East
- Africa
- Company Profiles
- BP Plc.
- Royal Dutch Shell Plc.
- Total SE
- Chevron Corporation
- ExxonMobil Corporation
- Engie SA
- RWE AG
- ON SE
- Vattenfall AB
- Gazprom
- Mitsubishi UFJ Financial Group (MUFG)
- JPMorgan Chase & Co
- Citigroup Inc.
- Barclays PLC
- Goldman Sachs Group, Inc.
Table of Contents
1. Research Objectives and Assumptions
- Research Objectives
- Assumptions
- Abbreviations
2. Market Purview
- Report Description
- Market Definition and Scope
- Executive Summary
- Emissions Trading Market, By Trading Type
- Emissions Trading Market, By End Use
- Emissions Trading Market, By Region
- Coherent Opportunity Map (COM)
3. Market Dynamics, Regulations, and Trends Analysis
- Market Dynamics
- Drivers
- Environmental concerns and climate change mitigation
- Regulatory compliance and international commitments
- Economic efficiency and cost-effectiveness
- Stimulating clean technologies and innovation
- Restraints
- Lack of commitment by large emitters
- Prevalence of free allocation of emissions allowances
- Carbon leakage risk
- Opportunities
- Expansion of emissions trading schemes
- Linking emissions trading systems
- Inclusion of new greenhouse gases
- Market-based solutions for net-Zero goals
- Key Highlights
- Regulatory Scenario
- Recent Trends
- Product Launches/Approvals
- PEST Analysis
- PORTER's Analysis
- Mergers, Acquisitions, and Collaborations
4. Emissions Trading Market, By Trading Type, 2020-2032, (US$ Mn)
- Introduction
- Market Share Analysis, 2025 and 2032 (%)
- Y-o-Y Growth Analysis, 2021 - 2032
- Segment Trends
- Cap-and-Trade
- Introduction
- Market Size and Forecast, and Y-o-Y Growth, 2020-2032,(US$ Mn)
- Baseline-and-Credit
- Introduction
- Market Size and Forecast, and Y-o-Y Growth, 2020-2032,(US$ Mn)
5. Emissions Trading Market, By End Use, 2020-2032, (US$ Mn)
- Introduction
- Market Share Analysis, 2025 and 2032 (%)
- Y-o-Y Growth Analysis, 2021 - 2032
- Segment Trends
- Energy
- Introduction
- Market Size and Forecast, and Y-o-Y Growth, 2020-2032, (US$ Million)
- Power Generation
- Introduction
- Market Size and Forecast, and Y-o-Y Growth, 2020-2032, (US$ Million)
- Industrial
- Introduction
- Market Size and Forecast, and Y-o-Y Growth, 2020-2032, (US$ Million)
- Transportation
- Introduction
- Market Size and Forecast, and Y-o-Y Growth, 2020-2032, (US$ Million)
- Agriculture
- Introduction
- Market Size and Forecast, and Y-o-Y Growth, 2020-2032, (US$ Million)
6. Emission Trading Market, By Region, 2020-2032, (US$ Mn)
- Introduction
- Market Share Analysis, By Sub-region, 2025 and 2032 (%)
- Y-o-Y Growth Analysis, For Sub-region, 2021 - 2032
- Segment Trends
- North America
- Introduction
- Market Size and Forecast, and Y-o-Y Growth, By Trading Type , 2020-2032,(US$ Mn)
- Market Size and Forecast, and Y-o-Y Growth, By End Use, 2020-2032,(US$ Mn)
- Market Size and Forecast, and Y-o-Y Growth, By Country, 2020-2032,(US$ Mn)
- U.S.
- Canada
- Europe
- Introduction
- Market Size and Forecast, and Y-o-Y Growth, By Trading Type , 2020-2032,(US$ Mn)
- Market Size and Forecast, and Y-o-Y Growth, By End Use, 2020-2032,(US$ Mn)
- Market Size and Forecast, and Y-o-Y Growth, By Country, 2020-2032,(US$ Mn)
- Germany
- U.K.
- Spain
- France
- Italy
- Russia
- Rest of Europe
- Asia Pacific
- Introduction
- Market Size and Forecast, and Y-o-Y Growth, By Trading Type , 2020-2032,(US$ Mn)
- Market Size and Forecast, and Y-o-Y Growth, By End Use, 2020-2032,(US$ Mn)
- Market Size and Forecast, and Y-o-Y Growth, By Country, 2020-2032,(US$ Mn)
- China
- India
- Japan
- Australia
- South Korea
- ASEAN
- Rest of Asia Pacific
- Latin America
- Introduction
- Market Size and Forecast, and Y-o-Y Growth, By Trading Type , 2020-2032,(US$ Mn)
- Market Size and Forecast, and Y-o-Y Growth, By End Use, 2020-2032,(US$ Mn)
- Market Size and Forecast, and Y-o-Y Growth, By Country, 2020-2032,(US$ Mn)
- Brazil
- Argentina
- Mexico
- Rest of Latin America
- Middle East & Africa
- Introduction
- Market Size and Forecast, and Y-o-Y Growth, By Trading Type , 2020-2032,(US$ Mn)
- Market Size and Forecast, and Y-o-Y Growth, By End Use, 2020-2032,(US$ Mn)
- Market Size and Forecast, and Y-o-Y Growth, By Country, 2020-2032,(US$ Mn)
- GCC Countries
- Israel
- South Africa
- North Africa
- Central Africa
- Rest of Middle East
7. Competitive Landscape
- Company Profile
- BP Plc.
- Company Highlights
- Product Portfolio
- Key Developments
- Financial Performance
- Strategies
- Royal Dutch Shell Plc
- Company Highlights
- Product Portfolio
- Key Highlights
- Financial Performance
- Strategies
- Total SE
- Company Highlights
- Product Portfolio
- Key Highlights
- Financial Performance
- Strategies
- Chevron Corporation
- Company Highlights
- Product Portfolio
- Key Highlights
- Financial Performance
- Strategies
- ExxonMobil Corporation
- Company Highlights
- Product Portfolio
- Key Highlights
- Financial Performance
- Strategies
- Engie SA
- Company Highlights
- Product Portfolio
- Key Highlights
- Financial Performance
- Strategies
- RWE AG
- Company Highlights
- Product Portfolio
- Key Highlights
- Financial Performance
- Strategies
- ON SE
- Company Highlights
- Product Portfolio
- Key Highlights
- Financial Performance
- Strategies
- Vattenfall AB
- Company Highlights
- Product Portfolio
- Key Highlights
- Financial Performance
- Strategies
- Gazprom
- Company Highlights
- Product Portfolio
- Key Highlights
- Financial Performance
- Strategies
- Mitsubishi UFJ Financial Group (MUFG)
- Company Highlights
- Product Portfolio
- Key Highlights
- Financial Performance
- Strategies
- JPMorgan Chase & Co.
- Company Highlights
- Product Portfolio
- Key Highlights
- Financial Performance
- Strategies
- Goldman Sachs Group, Inc.
- Company Highlights
- Product Portfolio
- Key Highlights
- Financial Performance
- Strategies
- Citigroup Inc.
- Company Highlights
- Product Portfolio
- Key Highlights
- Financial Performance
- Strategies
- Barclays PLC
- Company Highlights
- Product Portfolio
- Key Highlights
- Financial Performance
- Strategies
- Analyst Views
8. Section
- References
- Research Methodology
- About us