


|
시장보고서
상품코드
1699464
전임상 이미징 시장 : 제품별, 용도별, 최종사용자별, 지역별Global Preclinical Imaging Market, By Product, By Application, By End User, By Geography |
||||||
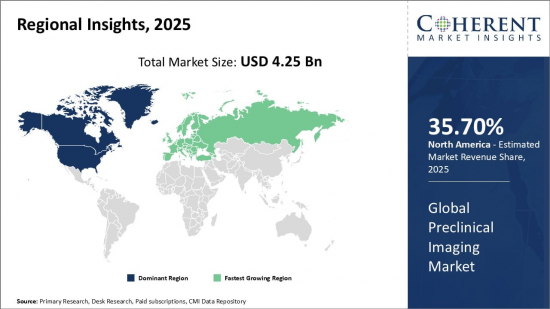
세계의 전임상 이미징 시장은 2025년에는 42억 5,000만 달러로 추정되며, 2032년까지는 61억 5,000만 달러에 달할 것으로 예측되며, 2025-2032년 CAGR은 5.4%로 추이할 것으로 예측됩니다.
| 리포트 범위 | 리포트 상세 | ||
|---|---|---|---|
| 기준연도 | 2024년 | 2025년 시장 규모 | 42억 5,000만 달러 |
| 실적 데이터 | 2020-2024년 | 예측 기간 | 2025-2032년 |
| 예측 기간 : 2025-2032년 CAGR : | 5.40% | 2032년 금액 예측 | 61억 5,000만 달러 |
전임상 이미징은 생물의학에서 연구개발(R&D) 파이프라인의 중요한 측면이며, 이를 통해 연구자들은 인간 임상시험으로 넘어가기 전에 동물 모델에서 질병의 진행을 시각화하고 추적하며, 약물의 약동학을 평가하고, 치료 반응을 모니터링할 수 있습니다. 이 분야에서는 자기공명영상(MRI), 컴퓨터단층촬영(CT), 양전자방사단층촬영(PET), 단광자방사단층촬영(SPECT), 초음파(US), 광이미징(생물발광 및 형광) 등 다양한 영상기법을 활용하여 여러 시점에 동물을 희생시키지 않고도 생물학적 과정과 치료 효과에 대한 귀중한 데이터를 수집하고 있습니다. 전임상 이미징의 장점은 동일 동물 내에서 질병의 종단적 연구를 용이하게 함으로써 연구에 필요한 동물 수를 줄이고 수집된 데이터의 통계적 유의성을 향상시킬 수 있다는 점입니다. 또한 질병의 진행과 퇴행을 실시간으로 역동적으로 관찰할 수 있으며, 치료 중재의 작용기전에 대한 인사이트를 얻을 수 있습니다. 전임상 이미징 분야는 비침습적 이미징 기술에 대한 수요 증가와 이러한 영상 기술이 매우 중요한 생의학 연구의 성장으로 인해 크게 성장하고 있습니다. 분자 이미징 기술의 발전은 인공지능(AI) 및 머신러닝(ML) 알고리즘의 통합과 함께 이미지 획득, 처리 및 분석을 개선하여 질병 병태생리 및 치료 효과에 대한 더 깊은 인사이트를 제공합니다. 또한 학계, 연구소, 제약사 간의 협력이 활발해지면서 다양한 연구 프로젝트에 새로운 이미징 솔루션을 통합할 수 있는 기회가 많아지고 있습니다. 전임상 이미징 시장의 주요 기업은 두 가지 이상의 이미징 방식을 결합한 하이브리드 이미징 시스템에 중점을 두고 기술 발전에 주력하고 있습니다. 이러한 접근 방식은 각 기술의 장점을 활용하여 생물학적 현상을 보다 종합적으로 이해하기 위한 것입니다. 또한 연구 활동 증가와 전임상 이미징 장비 및 서비스를 필요로 하는 연구시설의 신설로 인해 신흥 시장도 강력한 성장 기회를 보이고 있습니다.
시장 역학:
의약품 개발 및 질병 모델링을 위한 전임상 연구를 촉진하기 위한 정부 투자 증가는 전임상 이미징 시장의 주요 촉진요인입니다. 그러나 이미징 시스템과 관련된 높은 비용이 문제점으로 지적되고 있습니다. 학술기관 및 신흥 시장에서의 연구를 지원할 수 있는 저렴한 가격의 휴대용 이미징 장비 개발의 기회가 있습니다.
본 조사의 주요 특징
- 세계의 전임상 이미징(Preclinical Imaging) 시장을 상세하게 분석했으며, 2024년을 기준 연도로 하여 예측 기간(2025-2032년) 시장 규모와 연평균 성장률(CAGR)에 대해 조사 분석하여 전해드립니다.
- 또한 다양한 부문의 잠재적 매출 기회를 밝히고, 이 시장의 매력적인 투자 제안 매트릭스를 설명합니다.
- 또한 시장 성장 촉진요인, 억제요인, 기회, 신제품 출시 및 승인, 시장 동향, 지역별 전망, 주요 기업의 경쟁 전략 등에 대한 중요한 인사이트을 제공합니다.
- 이 보고서는 기업 하이라이트, 제품 포트폴리오, 주요 하이라이트, 재무 성과, 전략 등의 매개 변수를 기반으로 세계 전임상 이미징 시장의 주요 기업을 프로파일링합니다.
- 이 보고서의 인사이트를 통해 마케팅 담당자와 기업 경영진은 향후 제품 출시, 유형화, 시장 확대, 마케팅 전술에 대한 정보에 입각한 의사결정을 내릴 수 있습니다.
- 세계의 전임상 이미징 시장 보고서는 투자자, 공급업체, 제품 제조업체, 유통업체, 신규 시장 진출기업, 재무 분석가 등 업계의 다양한 이해관계자를 대상으로 합니다.
- 이해관계자들은 세계 전임상 이미징 시장 분석에 사용되는 다양한 전략 매트릭스를 통해 의사결정을 쉽게 내릴 수 있습니다.
목차
제1장 조사 목적과 전제조건
- 조사 목적
- 전제조건
- 약어
제2장 시장의 전망
- 리포트 설명
- 시장의 정의와 범위
- 개요
- Coherent Opportunity Map(COM)
제3장 시장 역학, 규제, 동향 분석
- 시장 역학
- 만성질환과 감염증의 만연
- 전임상 영상 진단 기기에 관련된 고비용
- 전임상 연구 활동에서 의약품 아웃소싱의 증가
- 주요 하이라이트
- 규제 시나리오
- 최근 동향
- 제품 발매/승인
- PEST 분석
- PORTER의 산업 분석
- 합병, 인수, 제휴
제4장 세계의 전임상 이미징 시장 - 코로나바이러스(COVID-19) 팬데믹의 영향
- COVID-19 역학
- 공급측과 수요측 분석
- 경제에 대한 영향
제5장 세계의 전임상 이미징 시장, 제품별, 2020-2032년
- CT 영상
- MRI 영상
- PET/SPECT 이미징
- 멀티모달 이미징
- 광학 이미징
- 초음파 영상 진단
- 광음향 이미징
- 시약
- 서비스
제6장 세계의 전임상 이미징 시장, 용도별, 2020-2032년
- 연구개발
- Drug Discovery
제7장 세계의 전임상 이미징 시장, 최종사용자별, 2020-2032년
- 제약·바이오테크놀러지 기업
- 연구기관
- 기타
제8장 세계의 전임상 이미징 시장, 지역별, 2020-2032년
- 북미
- 유럽
- 아시아태평양
- 라틴아메리카
- 중동
- 아프리카
제9장 경쟁 구도
- 기업 개요
- Bruker Corporation
- Siemens AG
- General Electric(GE)
- TriFoil Imaging
- PerkinElmer, Inc.
- VisualSonics Inc.(Fujifilm), Inc.
- Mediso Ltd.
- Agilent Technologies
- MILabs BV
- MR Solutions
- Molecubes
제10장 섹션
- 참고 문헌
- 조사 방법
- 출판사 소개
Global Preclinical Imaging Market is estimated to be valued at USD 4.25 Bn in 2025 and is expected to reach USD 6.15 Bn by 2032, growing at a compound annual growth rate (CAGR) of 5.4% from 2025 to 2032.
| Report Coverage | Report Details | ||
|---|---|---|---|
| Base Year: | 2024 | Market Size in 2025: | USD 4.25 Bn |
| Historical Data for: | 2020 To 2024 | Forecast Period: | 2025 To 2032 |
| Forecast Period 2025 to 2032 CAGR: | 5.40% | 2032 Value Projection: | USD 6.15 Bn |

Preclinical imaging is a critical aspect of the research and development (R&D) pipeline in the biomedical sciences, thereby enabling researchers to visualize and track the progression of diseases, assess the pharmacokinetics of drugs, and monitor therapeutic responses in animal models before they are being translated into human clinical trials. This field leverages various imaging modalities, such as magnetic resonance imaging (MRI), computed tomography (CT), positron emission tomography (PET), single-photon emission computed tomography (SPECT), ultrasound (US), and optical imaging (bioluminescence and fluorescence), to gather valuable data about biological processes and the effects of treatments without the need to sacrifice the animal subjects at multiple time points. The advantage of preclinical imaging is that it facilitates the longitudinal studies of disease within the same animal, thus reducing the number of animals required for research and improving the statistical significance of the data collected. Further on, it allows for the dynamic observation of disease progression and regression in real-time, which can provide insights into the mechanisms of action of therapeutic interventions. The preclinical imaging sector is experiencing significant growth driven by the rising demand for non-invasive imaging techniques and the growth in biomedical research where these modalities are crucial. Advancements in molecular imaging technologies, along with the integration of artificial intelligence (AI) and machine learning (ML) algorithms, are improving image acquisition, processing, and analysis, thus offering deeper insights into disease pathologies and treatment effects. Collaborations between academic institutions, research laboratories, and pharmaceutical companies are also intensifying, thereby providing numerous opportunities for the integration of novel imaging solutions into various research projects. Key market players in the preclinical imaging market are focusing on technological advancements, with an emphasis on hybrid imaging systems that combine two or more imaging modalities. This approach leverages the strengths of each technique to provide a more comprehensive understanding of biological phenomena. Furthermore, emerging markets are also exhibiting robust growth opportunities due to an increase in research activities and the establishment of new research facilities that require preclinical imaging equipment and services.
Market Dynamics:
Rising government investments to promote preclinical research for drug development and disease modeling is a major driver for the preclinical imaging market. However, high costs that are associated with imaging systems pose a challenge. Opportunities lie in the development of affordable and portable imaging devices to support research in academic institutions and emerging markets.
Key features of the study:
- This report provides in-depth analysis of the global preclinical imaging market, and provides market size (US$ Bn) and compound annual growth rate (CAGR %) for the forecast period (2025-2032), considering 2024 as the base year
- It elucidates potential revenue opportunities across different segments and explains attractive investment proposition matrices for this market
- This study also provides key insights about market drivers, restraints, opportunities, new product launches or approval, market trends, regional outlook, and competitive strategies adopted by key players
- It profiles key players in the global preclinical imaging market based on the following parameters - company highlights, products portfolio, key highlights, financial performance, and strategies
- Key companies covered as a part of this study include Bruker Corporation, Siemens A.G., General Electric (GE), TriFoil Imaging, PerkinElmer, Inc., VisualSonics Inc.(Fujifilm), Inc., Mediso Ltd., Agilent Technologies, MILabs B.V., MR Solutions, and Molecubes.
- Insights from this report would allow marketers and the management authorities of the companies to make informed decisions regarding their future product launches, type up-gradation, market expansion, and marketing tactics
- Global preclinical imaging market report caters to various stakeholders in this industry including investors, suppliers, product manufacturers, distributors, new entrants, and financial analysts
- Stakeholders would have ease in decision-making through various strategy matrices used in analyzing the global preclinical imaging market
Detailed Segmentation:
- Global Preclinical Imaging Market, By Product
- CT Imaging
- MRI Imaging
- PET/SPECT Imaging
- Multi-modal Imaging
- Optical Imaging
- Ultrasound Imaging
- Photoacoustic Imaging
- Reagents
- Services
- Global Preclinical Imaging Market, By Application
- Research and Development
- Drug Discovery
- Global Preclinical Imaging Market, By End User
- Pharma and Biotech Companies
- Research Institutes
- Others
- Global Preclinical Imaging Market, By Region
- North America
- Europe
- Asia Pacific
- Latin America
- Middle East & Africa
- Company Profiles
- Bruker Corporation
- Siemens A.G.
- General Electric(GE)
- TriFoil Imaging
- PerkinElmer, Inc.
- VisualSonics Inc. (Fujifilm), Inc.
- Mediso Ltd.
- Agilent Technologies
- MILabs B.V.
- MR Solutions
- Molecubes
Table of Contents
1. Research Objectives and Assumptions
- Research Objectives
- Assumptions
- Abbreviations
2. Market Purview
- Report Description
- Market Definition and Scope
- Executive Summary
- Market Preclinical Imaging, By Product
- Market Preclinical Imaging, By Application
- Market Preclinical Imaging, By End User
- Market Preclinical Imaging, By Region
- Coherent Opportunity Map (COM)
3. Market Dynamics, Regulations, and Trends Analysis
- Market Dynamics
- Growing prevalence of chronic and infectious diseases
- High costs associated with preclinical imaging instruments
- Growth in pharmaceutical outsourcing for preclinical research activities
- Key Highlights
- Regulatory Scenario
- Recent Trends
- Product Launches/Approvals
- PEST Analysis
- PORTER's Analysis
- Mergers, Acquisitions, and Collaborations
4. Global Preclinical Imaging Market- Impact of Coronavirus (COVID-19) Pandemic
- COVID-19 Epidemiology
- Supply Side and Demand Side Analysis
- Economic Impact
5. Global Preclinical Imaging Market, By Product, 2020-2032, (US$ Bn)
- Introduction
- Market Share Analysis, 2025 and 2032 (%)
- Y-o-Y Growth Analysis, 2021 - 2032
- Segment Trends
- CT Imaging
- Introduction
- Market Size and Forecast, and Y-o-Y Growth, 2020-2032,(US$ Bn)
- MRI Imaging
- Introduction
- Market Size and Forecast, and Y-o-Y Growth, 2020-2032,(US$ Bn)
- PET/SPECT Imaging
- Introduction
- Market Size and Forecast, and Y-o-Y Growth, 2020-2032,(US$ Bn)
- Multi-modal Imaging
- Introduction
- Market Size and Forecast, and Y-o-Y Growth, 2020-2032,(US$ Bn)
- Optical Imaging
- Introduction
- Market Size and Forecast, and Y-o-Y Growth, 2020-2032,(US$ Bn)
- Ultrasound Imaging
- Introduction
- Market Size and Forecast, and Y-o-Y Growth, 2020-2032,(US$ Bn)
- Photoacoustic Imaging
- Introduction
- Market Size and Forecast, and Y-o-Y Growth, 2020-2032,(US$ Bn)
- Reagents
- Introduction
- Market Size and Forecast, and Y-o-Y Growth, 2020-2032,(US$ Bn)
- Services
- Introduction
- Market Size and Forecast, and Y-o-Y Growth, 2020-2032,(US$ Bn)
6. Global Preclinical Imaging Market, By Application, 2020-2032, (US$ Bn)
- Introduction
- Market Share Analysis, 2025 and 2032 (%)
- Y-o-Y Growth Analysis, 2021-2032
- Segment Trends
- Research and Development
- Introduction
- Market Size and Forecast, and Y-o-Y Growth, 2020-2032,(US$ Bn)
- Drug Discovery
- Introduction
- Market Size and Forecast, and Y-o-Y Growth, 2020-2032,(US$ Bn)
7. Global Preclinical Imaging Market, By End User, 2020-2032, (US$ Bn)
- Introduction
- Market Share Analysis, 2025 and 2032 (%)
- Y-o-Y Growth Analysis, 2021-2032
- Segment Trends
- Pharma and Biotech Companies
- Introduction
- Market Size and Forecast, and Y-o-Y Growth, 2020-2032,(US$ Bn)
- Research Institutes
- Introduction
- Market Size and Forecast, and Y-o-Y Growth, 2020-2032,(US$ Bn)
- Others
- Introduction
- Market Size and Forecast, and Y-o-Y Growth, 2020-2032,(US$ Bn)
8. Global Preclinical Imaging Market, By Region, 2020-2032, (US$ Bn)
- Introduction
- Market Share Analysis, By Region, 2025 and 2032 (%)
- Y-o-Y Growth Analysis, For Region, 2020-2032
- Country Trends
- North America
- Introduction
- Market Size and Forecast, and Y-o-Y Growth, By Product, 2020-2032,(US$ Bn)
- Market Size and Forecast, and Y-o-Y Growth, By Application, 2020-2032,(US$ Bn)
- Market Size and Forecast, and Y-o-Y Growth, By End User, 2020-2032,(US$ Bn)
- Market Size and Forecast, and Y-o-Y Growth, By Country, 2020-2032,(US$ Bn)
- U.S.
- Canada
- Europe
- Introduction
- Market Size and Forecast, and Y-o-Y Growth, By Product, 2020-2032,(US$ Bn)
- Market Size and Forecast, and Y-o-Y Growth, By Application, 2020-2032,(US$ Bn)
- Market Size and Forecast, and Y-o-Y Growth, By End User, 2020-2032,(US$ Bn)
- Market Size and Forecast, and Y-o-Y Growth, By Country, 2020-2032,(US$ Bn)
- Germany
- U.K.
- Spain
- France
- Italy
- Russia
- Rest of Europe
- Asia Pacific
- Introduction
- Market Size and Forecast, and Y-o-Y Growth, By Product, 2020-2032,(US$ Bn)
- Market Size and Forecast, and Y-o-Y Growth, By Application, 2020-2032,(US$ Bn)
- Market Size and Forecast, and Y-o-Y Growth, By End User, 2020-2032,(US$ Bn)
- Market Size and Forecast, and Y-o-Y Growth, By Country, 2020-2032,(US$ Bn)
- China
- India
- Japan
- Australia
- South Korea
- ASEAN
- Rest of Asia Pacific
- Latin America
- Introduction
- Market Size and Forecast, and Y-o-Y Growth, By Product, 2020-2032,(US$ Bn)
- Market Size and Forecast, and Y-o-Y Growth, By Application, 2020-2032,(US$ Bn)
- Market Size and Forecast, and Y-o-Y Growth, By End User, 2020-2032,(US$ Bn)
- Market Size and Forecast, and Y-o-Y Growth, By Country, 2020-2032,(US$ Bn)
- Brazil
- Argentina
- Mexico
- Rest of Latin America
- Middle East
- Introduction
- Market Size and Forecast, and Y-o-Y Growth, By Product, 2020-2032,(US$ Bn)
- Market Size and Forecast, and Y-o-Y Growth, By Application, 2020-2032,(US$ Bn)
- Market Size and Forecast, and Y-o-Y Growth, By End User, 2020-2032,(US$ Bn)
- Market Size and Forecast, and Y-o-Y Growth, By Country, 2020-2032,(US$ Bn)
- GCC Countries
- Israel
- Rest of Middle East
- Africa
- Introduction
- Market Size and Forecast, and Y-o-Y Growth, By Product, 2020-2032,(US$ Bn)
- Market Size and Forecast, and Y-o-Y Growth, By Application, 2020-2032,(US$ Bn)
- Market Size and Forecast, and Y-o-Y Growth, By End User, 2020-2032,(US$ Bn)
- Market Size and Forecast, and Y-o-Y Growth, By Country/Region, 2020-2032,(US$ Bn)
- South Africa
- North Africa
- Central Africa
9. Competitive Landscape
- Company Profile
- Bruker Corporation
- Product Portfolio
- Key Developments
- Financial Performance
- Strategies
- Siemens A.G.
- Product Portfolio
- Key Highlights
- Financial Performance
- Strategies
- General Electric(GE)
- Product Portfolio
- Key Highlights
- Financial Performance
- Strategies
- TriFoil Imaging
- Company Highlights
- Product Portfolio
- Key Highlights
- Financial Performance
- Strategies
- PerkinElmer, Inc.
- Company Highlights
- Product Portfolio
- Key Highlights
- Financial Performance
- Strategies
- VisualSonics Inc.(Fujifilm), Inc.
- Company Highlights
- Product Portfolio
- Key Highlights
- Financial Performance
- Strategies
- Mediso Ltd.
- Company Highlights
- Product Portfolio
- Key Highlights
- Financial Performance
- Strategies
- Agilent Technologies
- Company Highlights
- Product Portfolio
- Key Highlights
- Financial Performance
- Strategies
- MILabs B.V.
- Company Highlights
- Product Portfolio
- Key Highlights
- Financial Performance
- Strategies
- MR Solutions
- Company Highlights
- Product Portfolio
- Key Highlights
- Financial Performance
- Strategies
- Molecubes
- Company Highlights
- Product Portfolio
- Key Highlights
- Financial Performance
- Strategies
- Analyst Views
10. Section
- References
- Research Methodology
- About us
