|
시장보고서
상품코드
1699495
디스플레이 캘리브레이션 관리 툴 시장 : 디바이스 유형별, 캘리브레이션 서비스 유형별, 지역별Display Calibration Management Tools Market, By Device Type, By Calibration Service Type, By Geography |
||||||
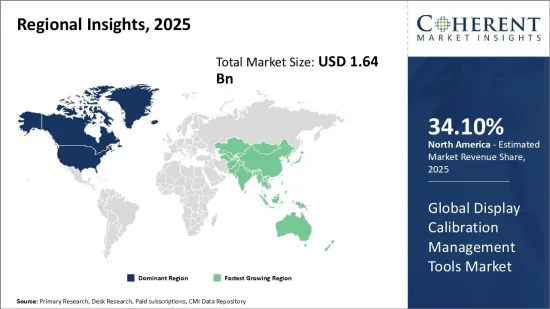
디스플레이 캘리브레이션 관리 툴 세계 시장 규모는 2025년에 16억 4,000만 달러로 추정되고, 2032년에는 24억 1,000만 달러에 달할 것으로 예상되며, 2025년부터 2032년까지 연평균 5.6%의 연평균 복합 성장률(CAGR)을 보일 것으로 예측됩니다.
| 보고 범위 | 보고서 상세 내용 | ||
|---|---|---|---|
| 기준 연도 | 2024년 | 2025년 시장 규모 | 16억 4,000만 달러 |
| 실적 데이터 | 2020-2024년 | 예측 기간 | 2025-2032년 |
| 예측 기간(2025-2032년) CAGR | 5.60% | 2032년 가치 예측 | 24억 1,000만 달러 |

디스플레이 캘리브레이션 관리 툴 세계 시장은 최근 몇 년 동안 괄목할 만한 성장을 이루었습니다. 디스플레이 캘리브레이션은 광고, 헬스케어, 소매, 상업시설 등 다양한 산업에서 널리 사용되는 디지털 디스플레이의 품질 관리 프로세스의 중요한 부분입니다. 캘리브레이션 관리 도구는 디스플레이의 색상 일관성, 화질, 최적의 성능을 보장하는 데 도움이 됩니다. 각 산업 분야의 디지털화와 프레젠테이션 및 시각화를 위한 대형 디스플레이월및 비디오 월의 사용이 증가함에 따라 디스플레이 캘리브레이션 솔루션에 대한 수요가 크게 증가하고 있습니다. 또한, OLED, miniLED 등 디스플레이 기술의 발전으로 다양한 디스플레이 모델에서 정확한 색 재현을 실현하고 브랜드 일관성을 확보하기 위해 캘리브레이션 프로그램을 도입하는 기업이 증가하고 있습니다. 디지털 사이니지를 통한 고객 경험에 대한 관심이 높아지면서 디스플레이 캘리브레이션 관리 툴 시장이 더욱 활성화되고 있습니다.
시장 역학:
디스플레이 캘리브레이션 관리 툴 세계 시장은 마케팅, 홍보, 고객 참여를 위한 디지털 사이니지의 채택이 각 산업 분야에서 확대되면서 시장을 견인할 것으로 예측됩니다. 또한 대형 디스플레이를 사용하여 시각화 기능을 강화하기 위한 조직의 투자 증가도 시장 성장을 가속하고 있습니다. 그러나 전문 디스플레이 캘리브레이션 솔루션 도입에 따른 높은 초기 비용이 시장을 어느 정도 억제할 수 있습니다. 원격 모니터링 및 중앙 집중식 제어 등의 이점을 제공하는 클라우드 기반 캘리브레이션 관리 플랫폼의 발전은 새로운 기회를 촉진하고 있습니다. 인터랙티브 키오스크, 헬스케어, 소매 분야에서의 터치스크린 및 지능형 디스플레이의 적용 확대는 공급업체에게 확장의 길을 열어주고 있습니다.
이 조사의 주요 특징
세계의 디스플레이 캘리브레이션 관리 툴(Display Calibration Management Tool) 시장에 대해 조사 분석했으며, 2024년을 기준 연도로 하여 예측 기간(2025-2032년) 시장 규모와 연평균 성장률(CAGR)을 조사 분석하여 전해드립니다.
또한, 다양한 부문에 걸친 잠재적 수익 기회를 밝히고, 이 시장의 매력적인 투자 제안 매트릭스를 설명합니다.
또한 시장 성장 촉진요인, 억제요인, 기회, 신제품 출시 및 승인, 시장 동향, 지역별 전망, 주요 기업의 경쟁 전략 등에 대한 중요한 고찰을 제공합니다.
이 보고서는 기업 하이라이트, 제품 포트폴리오, 주요 하이라이트, 재무 성과, 전략 등의 매개 변수를 기반으로 세계 디스플레이 캘리브레이션 관리 툴 시장의 주요 기업 프로파일을 제공합니다.
주요 기업으로는 LG Electronics Inc., Datacolor AG, EIZO Corporation, NEC Display Solutions, Portrait Displays Inc. General Digital Corporation, X-Rite Incorporated, Light Illusion Ltd., BenQ Corporation, Barco NV, Dell Technologies, ASUS, ViewSonic Corporation, Sony Corporation 등이 있습니다. Sony Corporation 등이 포함됩니다.
이 보고서의 통찰력을 통해 마케팅 담당자와 기업 경영진은 향후 제품 출시, 유형화, 시장 확대, 마케팅 전략에 대한 정보에 입각한 의사결정을 내릴 수 있습니다.
디스플레이 캘리브레이션 관리 툴 세계 시장 보고서는 투자자, 공급업체, 제품 제조업체, 유통업체, 신규 시장 진출기업, 재무 분석가 등 다양한 이해관계자를 대상으로 합니다.
이해관계자들은 세계 디스플레이 캘리브레이션 관리 툴 시장 분석에 사용되는 다양한 전략 매트릭스를 통해 의사결정을 용이하게 할 수 있습니다.
목차
제1장 조사 목적과 전제조건
- 조사 목적
- 전제조건
- 약어
제2장 시장 전망
- 보고서 설명
- 시장 정의와 범위
- 주요 요약
제3장 시장 역학, 규제, 동향 분석
- 시장 역학
- 영향 분석
- 주요 하이라이트
- 규제 시나리오
- 제품 발매/승인
- PEST 분석
- PORTER 분석
- 시장 기회
- 규제 시나리오
- 주요 발전
- 업계 동향
제4장 세계의 디스플레이 캘리브레이션 관리 툴 시장, 디바이스 유형별, 2020년-2032년
- 표준 사이니지 모니터
- 디지털 TV
- 비디오 월
- 전문 모니터
제5장 세계의 디스플레이 캘리브레이션 관리 툴 시장, 캘리브레이션 서비스 유형별, 2020년-2032년
- 3D LUT 캘리브레이션
- 3PT/6PT 캘리브레이션
- ICC 프로파일 기반 캘리브레이션
제6장 세계의 디스플레이 캘리브레이션 관리 툴 시장, 지역별, 2020년-2032년
- 북미
- 라틴아메리카
- 유럽
- 아시아태평양
- 중동
- 아프리카
제7장 경쟁 구도
- LG Electronics Inc.
- Datacolor AG
- EIZO Corporation
- NEC Display Solutions(NEC Corporation)
- Portrait Displays Inc.
- QUBYX Software Technologies Ltd.
- General Digital Corporation
- X-Rite Incorporated
- Light Illusion Ltd.
- BenQ Corporation
- Barco NV
- Dell Technologies
- ASUS
- ViewSonic Corporation
- Sony Corporation
제8장 애널리스트 추천 사항
- Wheel of Fortune
- 애널리스트의 견해
- COM(Coherent Opportunity Map)
제9장 참고 문헌과 조사 방법
- 참고 문헌
- 조사 방법
- 출판사에 대해
Global Display Calibration Management Tools Market is estimated to be valued at US$ 1.64 Bn in 2025 and is expected to reach US$ 2.41 Bn by 2032, growing at a compound annual growth rate (CAGR) of 5.6% from 2025 to 2032.
| Report Coverage | Report Details | ||
|---|---|---|---|
| Base Year: | 2024 | Market Size in 2025: | USD 1.64 Bn |
| Historical Data for: | 2020 To 2024 | Forecast Period: | 2025 To 2032 |
| Forecast Period 2025 to 2032 CAGR: | 5.60% | 2032 Value Projection: | USD 2.41 Bn |
The global display calibration management tools market has been witnessing significant growth in recent years. Display calibration is an important part of quality control process for digital displays used widely in various industries such as advertising, healthcare, retail, commercial installations, and others. Calibration management tools help ensure color consistency, image quality, and optimal performance of displays. With growing digitization across industries and increasing use of large display walls and video walls for presentations and visualization, the demand for display calibration solutions is growing substantially. Advancements in display technologies such as OLED and miniLED are also driving more organizations to implement calibration programs to get accurate color rendition on varying display models and ensure brand consistency. The rising focus on customer experience through digital signage is further propelling the display calibration management tools market.
Market Dynamics:
The global display calibration management tools market is expected to be driven by growing adoption of digital signage across industries for marketing, promotions, and customer engagement. Increasing investments by organizations to enhance visualization capabilities using large displays is also supporting market growth. However, high initial costs associated with the deployment of professional display calibration solutions could restrain the market to some extent. Advancements in cloud-based calibration management platforms offering benefits like remote monitoring and centralized control are fueling new opportunities. Rising application of touch screens and intelligent displays in interactive kiosks, healthcare and retail sectors presents an expanding avenue for providers.
Key Features of the Study:
This report provides in-depth analysis of the global display calibration management tools market, and provides market size (US$ Billion) and compound annual growth rate (CAGR%) for the forecast period (2025-2032), considering 2024 as the base year
It elucidates potential revenue opportunities across different segments and explains attractive investment proposition matrices for this market
This study also provides key insights about market drivers, restraints, opportunities, new product launches or approvals, market trends, regional outlook, and competitive strategies adopted by key players
It profiles key players in the global display calibration management tools market based on the following parameters - company highlights, products portfolio, key highlights, financial performance, and strategies
Key companies covered as a part of this study include LG Electronics Inc., Datacolor AG, EIZO Corporation, NEC Display Solutions (NEC Corporation), Portrait Displays Inc., QUBYX Software Technologies Ltd., General Digital Corporation, X-Rite Incorporated, Light Illusion Ltd., BenQ Corporation, Barco NV, Dell Technologies, ASUS, ViewSonic Corporation, and Sony Corporation
Insights from this report would allow marketers and the management authorities of the companies to make informed decisions regarding their future product launches, type up-gradation, market expansion, and marketing tactics
The global display calibration management tools market report caters to various stakeholders in this industry including investors, suppliers, product manufacturers, distributors, new entrants, and financial analysts
Stakeholders would have ease in decision-making through various strategy matrices used in analyzing the global display calibration management tools market
Market Segmentation
- Device Type Insights (Revenue, USD Bn, 2020 - 2032)
- Standard Signage Monitor
- Digital TV
- Video Wall
- Professional Monitors
- Calibration Service Type Insights (Revenue, USD Bn, 2020 - 2032)
- 3D LUT Calibration
- 3PT or 6PT Calibration
- ICC Profile-Based Calibration
- Regional Insights (Revenue, USD Bn, 2020 - 2032)
- North America
- U.S.
- Canada
- Latin America
- Brazil
- Argentina
- Mexico
- Rest of Latin America
- Europe
- Germany
- U.K.
- Spain
- France
- Italy
- Russia
- Rest of Europe
- Asia Pacific
- China
- India
- Japan
- Australia
- South Korea
- ASEAN
- Rest of Asia Pacific
- Middle East
- GCC Countries
- Israel
- Rest of Middle East
- Africa
- South Africa
- North Africa
- Central Africa
- Key Players Insights
- LG Electronics Inc.
- Datacolor AG
- EIZO Corporation
- NEC Display Solutions (NEC Corporation)
- Portrait Displays Inc.
- QUBYX Software Technologies Ltd.
- General Digital Corporation
- X-Rite Incorporated
- Light Illusion Ltd.
- BenQ Corporation
- Barco NV
- Dell Technologies
- ASUS
- ViewSonic Corporation
- Sony Corporation
Table of Contents
1. Research Objectives and Assumptions
- Research Objectives
- Assumptions
- Abbreviations
2. Market Purview
- Report Description
- Market Definition and Scope
- Executive Summary
- Global Display Calibration Management Tools Market, By Device Type
- Global Display Calibration Management Tools Market, By Calibration Service Type
- Global Display Calibration Management Tools Market, By Region
3. Market Dynamics, Regulations, and Trends Analysis
- Market Dynamics
- Impact Analysis
- Key Highlights
- Regulatory Scenario
- Product Launches/Approvals
- PEST Analysis
- PORTER's Analysis
- Market Opportunities
- Regulatory Scenario
- Key Developments
- Industry Trends
4. Global Display Calibration Management Tools Market, By Device Type, 2020-2032, (USD Bn)
- Introduction
- Market Share Analysis, 2025 and 2032 (%)
- Y-o-Y Growth Analysis, 2021 - 2032
- Segment Trends
- Standard Signage Monitor
- Introduction
- Market Size and Forecast, and Y-o-Y Growth, 2020-2032, (USD Bn)
- Digital TV
- Introduction
- Market Size and Forecast, and Y-o-Y Growth, 2020-2032, (USD Bn)
- Video Wall
- Introduction
- Market Size and Forecast, and Y-o-Y Growth, 2020-2032, (USD Bn)
- Professional Monitors
- Introduction
- Market Size and Forecast, and Y-o-Y Growth, 2020-2032, (USD Bn)
5. Global Display Calibration Management Tools Market, By Calibration Service Type, 2020-2032, (USD Bn)
- Introduction
- Market Share Analysis, 2025 and 2032 (%)
- Y-o-Y Growth Analysis, 2021 - 2032
- Segment Trends
- 3D LUT Calibration
- Introduction
- Market Size and Forecast, and Y-o-Y Growth, 2020-2032, (USD Bn)
- 3PT or 6PT Calibration
- Introduction
- Market Size and Forecast, and Y-o-Y Growth, 2020-2032, (USD Bn)
- ICC Profile-Based Calibration
- Introduction
- Market Size and Forecast, and Y-o-Y Growth, 2020-2032, (USD Bn)
6. Global Display Calibration Management Tools Market, By Region, 2020 - 2032, Value (USD Bn)
- Introduction
- Market Share (%) Analysis, 2025,2028 & 2032, Value (USD Bn)
- Market Y-o-Y Growth Analysis (%), 2021 - 2032, Value (USD Bn)
- Regional Trends
- North America
- Introduction
- Market Size and Forecast, By Device Type, 2020 - 2032, Value (USD Bn)
- Market Size and Forecast, By Calibration Service Type, 2020 - 2032, Value (USD Bn)
- Market Size and Forecast, By Country, 2020 - 2032, Value (USD Bn)
- U.S.
- Canada
- Latin America
- Introduction
- Market Size and Forecast, By Device Type, 2020 - 2032, Value (USD Bn)
- Market Size and Forecast, By Calibration Service Type, 2020 - 2032, Value (USD Bn)
- Market Size and Forecast, By Country, 2020 - 2032, Value (USD Bn)
- Brazil
- Argentina
- Mexico
- Rest of Latin America
- Europe
- Introduction
- Market Size and Forecast, By Device Type, 2020 - 2032, Value (USD Bn)
- Market Size and Forecast, By Calibration Service Type, 2020 - 2032, Value (USD Bn)
- Market Size and Forecast, By Country, 2020 - 2032, Value (USD Bn)
- Germany
- U.K.
- Spain
- France
- Italy
- Russia
- Rest of Europe
- Asia Pacific
- Introduction
- Market Size and Forecast, By Device Type, 2020 - 2032, Value (USD Bn)
- Market Size and Forecast, By Calibration Service Type, 2020 - 2032, Value (USD Bn)
- Market Size and Forecast, By Country, 2020 - 2032, Value (USD Bn)
- China
- India
- Japan
- Australia
- South Korea
- ASEAN
- Rest of Asia Pacific
- Middle East
- Introduction
- Market Size and Forecast, By Device Type, 2020 - 2032, Value (USD Bn)
- Market Size and Forecast, By Calibration Service Type, 2020 - 2032, Value (USD Bn)
- Market Size and Forecast, By Country, 2020 - 2032, Value (USD Bn)
- GCC Countries
- Israel
- Rest of Middle East
- Africa
- Introduction
- Market Size and Forecast, By Device Type, 2020 - 2032, Value (USD Bn)
- Market Size and Forecast, By Calibration Service Type, 2020 - 2032, Value (USD Bn)
- Market Size and Forecast, By Country/Region, 2020 - 2032, Value (USD Bn)
- South Africa
- North Africa
- Central Africa
7. Competitive Landscape
- LG Electronics Inc.
- Company Highlights
- Product Portfolio
- Key Developments
- Financial Performance
- Strategies
- Datacolor AG
- Company Highlights
- Product Portfolio
- Key Developments
- Financial Performance
- Strategies
- EIZO Corporation
- Company Highlights
- Product Portfolio
- Key Developments
- Financial Performance
- Strategies
- NEC Display Solutions (NEC Corporation)
- Company Highlights
- Product Portfolio
- Key Developments
- Financial Performance
- Strategies
- Portrait Displays Inc.
- Company Highlights
- Product Portfolio
- Key Developments
- Financial Performance
- Strategies
- QUBYX Software Technologies Ltd.
- Company Highlights
- Product Portfolio
- Key Developments
- Financial Performance
- Strategies
- General Digital Corporation
- Company Highlights
- Product Portfolio
- Key Developments
- Financial Performance
- Strategies
- X-Rite Incorporated
- Company Highlights
- Product Portfolio
- Key Developments
- Financial Performance
- Strategies
- Light Illusion Ltd.
- Company Highlights
- Product Portfolio
- Key Developments
- Financial Performance
- Strategies
- BenQ Corporation
- Company Highlights
- Product Portfolio
- Key Developments
- Financial Performance
- Strategies
- Barco NV
- Company Highlights
- Product Portfolio
- Key Developments
- Financial Performance
- Strategies
- Dell Technologies
- Company Highlights
- Product Portfolio
- Key Developments
- Financial Performance
- Strategies
- ASUS
- Company Highlights
- Product Portfolio
- Key Developments
- Financial Performance
- Strategies
- ViewSonic Corporation
- Company Highlights
- Product Portfolio
- Key Developments
- Financial Performance
- Strategies
- Sony Corporation
- Company Highlights
- Product Portfolio
- Key Developments
- Financial Performance
- Strategies
8. Analyst Recommendations
- Wheel of Fortune
- Analyst View
- Coherent Opportunity Map
9. References and Research Methodology
- References
- Research Methodology
- About us