|
시장보고서
상품코드
1705854
항공 데이터 인디케이터 시장 : 제품 유형별, 항공기 유형별, 최종사용자별, 용도별, 유통 채널별, 지역별Air Data Indicator Market, By Product Type, By Aircraft Type, By End User, By Application, By Distribution Channel, By Geography |
||||||
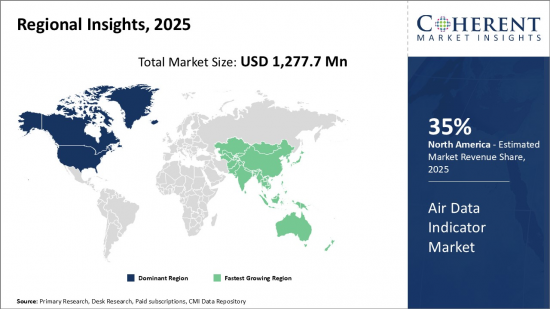
세계의 항공 데이터 인디케이터 시장은 2025년에 12억 7,770만 달러로 추정되며, 2032년에는 28억 7,790만 달러에 달할 것으로 예측되며, 2025-2032년의 CAGR은 12.3%로 성장할 것으로 예측됩니다.
| 리포트 범위 | 리포트 상세 | ||
|---|---|---|---|
| 기준연도 | 2024 | 2025년 시장 규모 | 12억 7,770만 달러 |
| 실적 데이터 | 2020-2024년 | 예측 기간 | 2025-2032년 |
| 예측 기간 : 2025-2032년 CAGR : | 12.30% | 2032년 가치 예측 | 28억 7,790만 달러 |
세계의 항공 데이터 인디케이터 시장은 중요한 비행 매개변수 측정 용도로 항공기에서 항공 데이터 표시기의 사용이 증가함에 따라 최근 수년간 큰 견인력을 얻고 있습니다. 항공 데이터 표시기는 항공기의 대기 속도, 고도, 수직 속도를 측정하고 표시하는 데 사용되는 계기입니다. 조종사가 항공기의 안전과 운항을 유지하는 데 중요한 역할을 합니다. 다양한 지역에서 항공기의 지속적인 증가와 항공기 안전에 대한 엄격한 규제 규범은 주로 첨단 항공 데이터 표시기에 대한 수요를 증가시키고 있습니다. 또한 유리 조종석 항공 전자공학의 채택이 증가하고 중요한 매개 변수가 디지털화됨에 따라 향후 수년간 항공 데이터 표시기의 판매를 촉진할 것으로 예측됩니다. 반면, 항공 데이터 표시기와 관련된 높은 유지보수 및 업그레이드 비용은 보급을 제한할 수 있습니다.
시장 역학:
세계 항공 데이터 표시기 시장은 항공기 인도 증가, 기존 항공기 업그레이드, 항공기 현대화에 대한 관심 증가, 비행 안전을 위한 엄격한 규제 기준 등 여러 요인으로 인해 예측 기간 중 강력한 성장세를 보일 것으로 예측됩니다. 또한 솔리드 스테이트 항공 데이터 센서 및 통합 항공전자 등 첨단 기술에 대한 주요 제조업체의 투자 확대는 시장 성장을 더욱 촉진하고 있습니다. 그러나 항공 데이터 지표의 업그레이드 및 정비와 관련된 높은 비용은 시장 기업의 매출 창출을 어느 정도 저해할 수 있습니다. 또한 정치적 불확실성, 지정학적 긴장, 유가 변동으로 인해 항공기 산업이 어려움을 겪으면서 항공 데이터 지표에 대한 수요를 억제하고 있습니다. 한편, 부품의 소형화와 다기능 통합 시스템의 개발은 항공 데이터 표시기 시장에 큰 기회를 제공합니다.
본 조사의 주요 특징
- 세계의 항공 데이터 표시기 시장에 대해 조사 분석했으며, 2024년을 기준 연도로 하여 예측 기간(2025-2032년) 시장 규모와 연평균 성장률(CAGR)을 조사하여 전해드립니다.
- 또한 다양한 부문에 걸친 잠재적인 매출 성장 기회를 밝히고, 이 시장의 매력적인 투자 제안 매트릭스를 설명합니다.
- 또한 시장 성장 촉진요인, 억제요인, 기회, 신제품 출시 및 승인, 시장 동향, 지역별 전망, 주요 기업의 경쟁 전략 등에 대한 주요 인사이트을 제공합니다.
- 이 보고서는 기업 하이라이트, 제품 포트폴리오, 주요 하이라이트, 재무 성과, 전략 등의 매개 변수를 기반으로 세계 항공 데이터 표시기 시장의 주요 기업을 프로파일링합니다.
- 이 보고서의 인사이트를 통해 마케팅 담당자와 기업 경영진은 향후 제품 출시, 유형화, 시장 확대, 마케팅 전술에 대한 정보에 입각한 의사결정을 내릴 수 있습니다.
- 이 보고서는 투자자, 공급업체, 제품 제조업체, 유통업체, 신규 시장 진출기업, 재무 분석가 등 업계의 다양한 이해관계자를 대상으로 합니다.
- 이해관계자들은 세계 항공 데이터 지표 시장 분석에 사용되는 다양한 전략 매트릭스를 통해 의사결정을 쉽게 내릴 수 있습니다.
목차
제1장 조사의 목적과 전제조건
- 조사 목적
- 전제조건
- 약어
제2장 시장의 전망
- 리포트 설명
- 시장의 정의와 범위
- 개요
- Coherent Opportunity Map(COM)
제3장 시장 역학, 규제, 동향 분석
- 시장 역학
- 드론 및 무인항공기에 대한 항공 데이터 시스템의 통합
- 항공기 생산과 납입의 증가
- 긴 제품 교체 주기
- 영향 분석
- 주요 하이라이트
- 규제 시나리오
- 제품의 발매/승인
- PEST 분석
- PORTER의 산업 분석
- 합병과 인수 시나리오
제4장 대기 데이터 인디케이터 시장 - 코로나바이러스(COVID-19) 팬데믹의 영향
- COVID-19 역학
- 공급측과 수요측 분석
- 경제에 대한 영향
제5장 대기 데이터 인디케이터 시장, 제품 유형별, 2020-2032년
- 고도계
- 대기속도계
- 수직 속도계
- 영각 인디케이터
- 기타
제6장 항공 데이터 인디케이터 시장, 항공기 유형별, 2020-2032년
- 고정익
- 회전익
제7장 에어 데이터 인디케이터 시장, 최종사용자별, 2020-2032년
- 상업 항공
- 군용 항공
- 일반 항공
제8장 대기 데이터 인디케이터 시장, 용도별, 2020-2032년
- 공수
- 트레이닝
- 방위
- 기타
제9장 대기 데이터 인디케이터 시장, 유통 채널별, 2020-2032년
- OEM
- 애프터마켓
제10장 대기 데이터 인디케이터 시장, 지역별, 2020-2032년
- 북미
- 유럽
- 아시아태평양
- 라틴아메리카
- 중동 및 아프리카
제11장 경쟁 구도
- Collins Aerospace
- Thommen Aircraft Equipment
- Mid-Continent Instruments & Avionics
- Mikrotechna Praha
- Barfield
- AeroControlex
- Falcon Gauge
- UMA Instruments
- Aircraft Spruce & Specialty Co.
- Others
제12장 섹션
- 조사 방법
- 출판사 소개
Global Air Data Indicator Market is estimated to be valued at USD 1,277.7 Mn in 2025 and is expected to reach USD 2,877.9 Mn by 2032, growing at a compound annual growth rate (CAGR) of 12.3% from 2025 to 2032.
| Report Coverage | Report Details | ||
|---|---|---|---|
| Base Year: | 2024 | Market Size in 2025: | USD 1,277.7 Mn |
| Historical Data for: | 2020 To 2024 | Forecast Period: | 2025 To 2032 |
| Forecast Period 2025 to 2032 CAGR: | 12.30% | 2032 Value Projection: | USD 2,877.9 Mn |

The global air data indicator market has been gaining significant traction over the recent years owing to the increasing use of air data indicators in aircraft for critical flight parameter measurement applications. An air data indicator is an instrument that is used to measure and display an aircraft's airspeed, altitude, and vertical speed. It plays a vital role for the pilots to maintain the safety of aircraft and its operations. The continuous growth of aircraft fleet across various regions and stringent regulatory norms regarding aircraft safety have been primarily augmenting the demand for advanced air data indicators. Moreover, the rising adoption of glass cockpit avionics and digitization of critical parameters are expected to propel the sales of air data indicators in the coming years. Meanwhile, high maintenance and upgrading costs associated with air data indicators may limit their widespread adoption.
Market Dynamics:
The global air data indicator market is projected to witness robust growth during the forecast period owing to several factors such as rising aircraft deliveries, upgradation of existing fleet, increasing focus on aircraft modernization, and stringent regulatory standards for flight safety. Additionally, boosting investments by prominent manufacturers in advanced technologies, such as solid-state air data sensors and integrated avionics, are further fueling the market growth. However, high costs associated with air data indicator upgrade and maintenance may hamper the revenue generation of market players to some extent. Moreover, political uncertainties, geopolitical tensions, and fluctuations in crude oil prices pose challenges for the aircraft industry, thereby restraining the demand for air data indicators. Meanwhile, the ongoing miniaturization of components and the development of multi-functional integrated systems present significant opportunities in the Air Data Indicator Market.
Key Features of the Study:
- This report provides an in-depth analysis of the global air data indicator market, and provides market size (US$ Million) and compound annual growth rate (CAGR%) for the forecast period (2025-2032), considering 2024 as the base year
- It elucidates potential revenue growth opportunities across different segments and explains attractive investment proposition matrices for this market
- This study also provides key insights about market drivers, restraints, opportunities, new product launches or approvals, market trends, regional outlook, and competitive strategies adopted by key players
- It profiles key players in the global air data indicator market based on the following parameters - company highlights, products portfolio, key highlights, financial performance, and strategies
- Key companies covered as a part of this study include Collins Aerospace, Thommen Aircraft Equipment, Mid-Continent Instruments & Avionics, Mikrotechna Praha, Barfield, and others
- Insights from this report would allow marketers and the management authorities of the companies to make informed decisions regarding their future product launches, type up-gradation, market expansion, and marketing tactics
- The global air data indicator market report caters to various stakeholders in this industry including investors, suppliers, product manufacturers, distributors, new entrants, and financial analysts
- Stakeholders would have ease in decision-making through various strategy matrices used in analyzing the global air data indicator market
Detailed Segmentation:
- By Product Type
- Altimeter
- Airspeed Indicator
- Vertical Speed Indicator
- Angle of Attack Indicator
- Others
- By Aircraft Type
- Fixed Wing
- Rotary Wing
- UAVs
- By End User
- Commercial Aviation
- Military Aviation
- General Aviation
- By Application
- Air Transport
- Training
- Defense
- Others
- By Distribution Channel
- OEMs
- Aftermarket
- By Region
- North America
- Europe
- Asia Pacific
- Latin America
- Middle East & Africa
- Company Profiles
- Collins Aerospace
- Thommen Aircraft Equipment
- Mid-Continent Instruments & Avionics
- Mikrotechna Praha
- Barfield
- AeroControlex
- Falcon Gauge
- UMA Instruments
- Aircraft Spruce & Specialty Co.
- Kelly Manufacturing
- Mitchell Aircraft Products
- Ahlers Aerospace
- Suzhou Changfeng Instruments
- LX navigation
- MAV Avionics
- Suzhou Changfeng Instruments Co. Ltd.
- Mid-Continent Instrument Co. Inc.
- D.C. ELECTRONIC INDUSTRIES
- Falcon Gauge
- Sigma Tek, Inc.
Table of Contents
1. Research Objectives and Assumptions
- Research Objectives
- Assumptions
- Abbreviations
2. Market Purview
- Report Description
- Market Definition and Scope
- Executive Summary
- Market Snippet, By Product Type
- Market Snippet, By Aircraft Type
- Market Snippet, By End User
- Market Snippet, By Application
- Market Snippet, By Distribution Channel
- Market Snippet, By Region
- Coherent Opportunity Map (COM)
3. Market Dynamics, Regulations, and Trends Analysis
- Market Dynamics
- Incorporation of air data systems in drones and UAVs
- Increasing aircraft production and deliveries
- Long product replacement cycles
- Impact Analysis
- Key Highlights
- Regulatory Scenario
- Product Launches/Approvals
- PEST Analysis
- PORTER's Analysis
- Merger and Acquisition Scenario
4. Air Data Indicator Market - Impact of Coronavirus (COVID-19) Pandemic
- COVID-19 Epidemiology
- Supply Side and Demand Side Analysis
- Economic Impact
5. Air Data Indicator Market, By Product Type, 2020-2032, (US$ Mn)
- Introduction
- Market Share Analysis, 2025 and 2032 (%)
- Y-o-Y Growth Analysis, 2021 - 2032
- Segment Trends
- Altimeter
- Introduction
- Market Size and Forecast, and Y-o-Y Growth, 2020-2032,(US$ Mn)
- Airspeed Indicator
- Introduction
- Market Size and Forecast, and Y-o-Y Growth, 2020-2032,(US$ Mn)
- Vertical Speed Indicator
- Introduction
- Market Size and Forecast, and Y-o-Y Growth, 2020-2032,(US$ Mn)
- Angle of Attack Indicator
- Introduction
- Market Size and Forecast, and Y-o-Y Growth, 2020-2032,(US$ Mn)
- Others
- Introduction
- Market Size and Forecast, and Y-o-Y Growth, 2020-2032,(US$ Mn)
6. Air Data Indicator Market, By Aircraft Type, 2020-2032, (US$ Mn)
- Introduction
- Market Share Analysis, 2025 and 2032 (%)
- Y-o-Y Growth Analysis, 2021 - 2032
- Segment Trends
- Fixed Wing
- Introduction
- Market Size and Forecast, and Y-o-Y Growth, 2020-2032,(US$ Million)
- Rotary Wing
- Introduction
- Market Size and Forecast, and Y-o-Y Growth, 2020-2032,(US$ Million)
7. Air Data Indicator Market, By End User, 2020-2032, (US$ Mn)
- Introduction
- Market Share Analysis, 2025 and 2032 (%)
- Y-o-Y Growth Analysis, 2021 - 2032
- Segment Trends
- Commercial Aviation
- Introduction
- Market Size and Forecast, and Y-o-Y Growth, 2020-2032,(US$ Million)
- Military Aviation
- Introduction
- Market Size and Forecast, and Y-o-Y Growth, 2020-2032,(US$ Million)
- General Aviation
- Introduction
- Market Size and Forecast, and Y-o-Y Growth, 2020-2032,(US$ Million)
8. Air Data Indicator Market, By Application, 2020-2032, (US$ Mn)
- Introduction
- Market Share Analysis, 2025 and 2032 (%)
- Y-o-Y Growth Analysis, 2021 - 2032
- Segment Trends
- Air Transport
- Introduction
- Market Size and Forecast, and Y-o-Y Growth, 2020-2032,(US$ Million)
- Training
- Introduction
- Market Size and Forecast, and Y-o-Y Growth, 2020-2032,(US$ Million)
- Defense
- Introduction
- Market Size and Forecast, and Y-o-Y Growth, 2020-2032,(US$ Million)
- Others
- Introduction
- Market Size and Forecast, and Y-o-Y Growth, 2020-2032,(US$ Million)
9. Air Data Indicator Market, By Distribution Channel, 2020-2032, (US$ Mn)
- Introduction
- Market Share Analysis, 2025 and 2032 (%)
- Y-o-Y Growth Analysis, 2021 - 2032
- Segment Trends
- OEMs
- Introduction
- Market Size and Forecast, and Y-o-Y Growth, 2020-2032,(US$ Million)
- Aftermarket
- Introduction
- Market Size and Forecast, and Y-o-Y Growth, 2020-2032,(US$ Million)
10. Air Data Indicator Market, By Region, 2020-2032, (US$ Mn)
- Introduction
- Market Share Analysis, By Country, 2025 and 2032 (%)
- Y-o-Y Growth Analysis, For Country, 2021 -2032
- Country Trends
- North America
- Introduction
- Market Size and Forecast, and Y-o-Y Growth, By Product Type, 2020-2032,(US$ Mn)
- Market Size and Forecast, and Y-o-Y Growth, By Aircraft Type, 2020-2032,(US$ Mn)
- Market Size and Forecast, and Y-o-Y Growth, By End User, 2020-2032,(US$ Mn)
- Market Size and Forecast, and Y-o-Y Growth, By Application, 2020-2032,(US$ Mn)
- Market Size and Forecast, and Y-o-Y Growth, By Distribution Channel, 2020-2032,(US$ Mn)
- Market Share Analysis, By Country, 2020 and 2032
- U.S.
- Canada
- Europe
- Introduction
- Market Size and Forecast, and Y-o-Y Growth, By Product Type, 2020-2032,(US$ Mn)
- Market Size and Forecast, and Y-o-Y Growth, By Aircraft Type, 2020-2032,(US$ Mn)
- Market Size and Forecast, and Y-o-Y Growth, By End User, 2020-2032,(US$ Mn)
- Market Size and Forecast, and Y-o-Y Growth, By Application, 2020-2032,(US$ Mn)
- Market Size and Forecast, and Y-o-Y Growth, By Distribution Channel, 2020-2032,(US$ Mn)
- Market Share Analysis, By Country, 2020 and 2032
- Germany
- U.K.
- France
- Italy
- Spain
- Russia
- Rest of Europe
- Asia Pacific
- Introduction
- Market Size and Forecast, and Y-o-Y Growth, By Product Type, 2020-2032,(US$ Mn)
- Market Size and Forecast, and Y-o-Y Growth, By Aircraft Type, 2020-2032,(US$ Mn)
- Market Size and Forecast, and Y-o-Y Growth, By End User, 2020-2032,(US$ Mn)
- Market Size and Forecast, and Y-o-Y Growth, By Application, 2020-2032,(US$ Mn)
- Market Size and Forecast, and Y-o-Y Growth, By Distribution Channel, 2020-2032,(US$ Mn)
- Market Share Analysis, By Country, 2020 and 2032
- China
- India
- Japan
- Australia
- South Korea
- ASEAN
- Latin America
- Introduction
- Market Size and Forecast, and Y-o-Y Growth, By Product Type, 2020-2032,(US$ Mn)
- Market Size and Forecast, and Y-o-Y Growth, By Aircraft Type, 2020-2032,(US$ Mn)
- Market Size and Forecast, and Y-o-Y Growth, By End User, 2020-2032,(US$ Mn)
- Market Size and Forecast, and Y-o-Y Growth, By Application, 2020-2032,(US$ Mn)
- Market Size and Forecast, and Y-o-Y Growth, By Distribution Channel, 2020-2032,(US$ Mn)
- Market Share Analysis, By Country, 2020 and 2032
- Brazil
- Mexico
- Rest Of Latin America
- Middle East & Africa
- Introduction
- Market Size and Forecast, and Y-o-Y Growth, By Product Type, 2020-2032,(US$ Mn)
- Market Size and Forecast, and Y-o-Y Growth, By Aircraft Type, 2020-2032,(US$ Mn)
- Market Size and Forecast, and Y-o-Y Growth, By End User, 2020-2032,(US$ Mn)
- Market Size and Forecast, and Y-o-Y Growth, By Application, 2020-2032,(US$ Mn)
- Market Size and Forecast, and Y-o-Y Growth, By Distribution Channel, 2020-2032,(US$ Mn)
- Market Share Analysis, By Country, 2020 and 2032
- South Africa
- GCC Countries
- Rest of the Middle East & Africa
11. Competitive Landscape
- Collins Aerospace
- Company Highlights
- Product Portfolio
- Key Developments
- Financial Performance
- Strategies
- Thommen Aircraft Equipment
- Company Highlights
- Product Portfolio
- Key Highlights
- Financial Performance
- Strategies
- Mid-Continent Instruments & Avionics
- Company Highlights
- Product Portfolio
- Key Highlights
- Financial Performance
- Strategies
- Mikrotechna Praha
- Barfield
- AeroControlex
- Falcon Gauge
- UMA Instruments
- Aircraft Spruce & Specialty Co.
- Others
- Analyst Views
12. Section
- Research Methodology
- About us