|
시장보고서
상품코드
1801920
HVDC 케이블 시장 기회, 성장 촉진요인, 산업 동향 분석 및 예측(2025-2034년)HVDC Cables Market Opportunity, Growth Drivers, Industry Trend Analysis, and Forecast 2025 - 2034 |
||||||
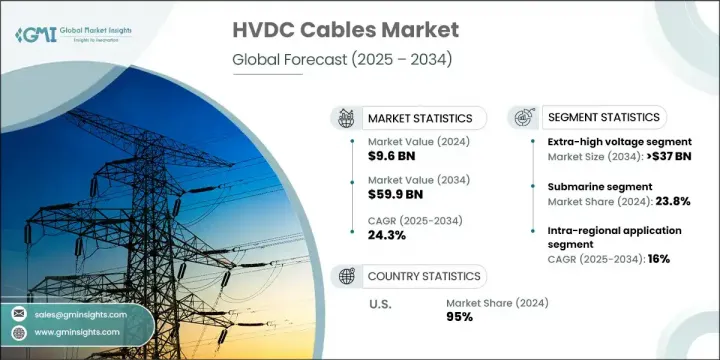
세계의 HVDC 케이블 시장은 2024년에는 96억 달러로 평가되었고, CAGR 24.3%로 성장하여 2034년까지는 599억 달러에 이를 것으로 추정되고 있습니다.
이러한 예외적인 성장은 지속 가능한 에너지 인프라를 추구하는 전 세계적인 움직임에 힘입은 바 큽니다. 정부와 에너지 공급업체가 재생에너지원을 전력망에 통합하는 데 주력하고 있는 가운데, HVDC 케이블 시스템은 효율적인 장거리 송전을 위한 중요한 도구로 부상하고 있습니다. 에너지 손실을 최소화하고 광활한 지역에 안정적인 송전을 할 수 있는 HVDC 케이블은 최신 저탄소 전력망에서 점점 더 많이 채택되고 있습니다. 탈탄소 에너지로의 전환은 송전 전략을 재구성하고 첨단 HVDC 기술에 대한 투자를 촉진하고 있습니다.

이러한 수요를 가속화하고 있는 주요 요인은 해상풍력 발전소 개발이 계속되고 있기 때문입니다. 풍력 발전 프로젝트가 더 먼 바다로 이동하고 터빈 용량이 증가함에 따라 내구성이 높고 고성능 송전 시스템에 대한 요구가 증가하고 있습니다. HVDC 케이블은 이러한 해상 시설에서 육상 송전망으로 전기를 전송하는 주요 솔루션이 되고 있습니다. 또한, 각국이 국경을 초월한 연결을 통해 전력을 공유함으로써 에너지 안보를 강화하려는 움직임이 활발해짐에 따라 상호연계 및 국경을 초월한 송전망 구축이 활발해지고 있습니다. 에너지의 흐름을 정확하게 관리할 수 있는 HVDC 기술은 이러한 송전망 프로젝트에 없어서는 안 될 필수 요소입니다.
| 시장 범위 | |
|---|---|
| 개시 연도 | 2024년 |
| 예측 연도 | 2025-2034년 |
| 개시 금액 | 96억 달러 |
| 예측 금액 | 599억 달러 |
| CAGR | 24.3% |
35kW - 475kW 부문은 에너지 연결 및 대용량 인프라에 대한 전 세계의 관심이 높아짐에 따라 2034년까지 연평균 23% 성장할 것으로 예측됩니다. 35kW에서 475kW의 전압 범위 시장은 대량 송전에서 중요한 역할을 하기 때문에 더 널리 채택되고 있습니다. 이 케이블은 수력 발전소나 해상 풍력 플랫폼과 같이 외딴 곳에 위치한 대규모 재생에너지원으로부터 전력을 전송하는 데 적합합니다.
지하 부문은 복잡한 지형과 도시 확장 지역에 적합하기 때문에 2034년까지 연평균 복합 성장률(CAGR) 16%를 보일 것으로 예측됩니다. 지하 HVDC 케이블은 도시지역과 산업지역이 공간 절약형 저부하 송전 시스템을 선호하기 때문에 수요가 증가할 것으로 예상하고 있습니다. 이러한 시스템은 혼잡한 장소나 환경에 민감한 장소에서 가공 송전선을 대체할 수 있는 실용적인 대안을 제공합니다.
아시아태평양 HVDC 케이블 시장은 2034년까지 8억 달러에 달할 것으로 예측됩니다. 도시 개발의 발전, 에너지 수요 증가, 재생 에너지의 통합은 이 지역 시장을 형성하는 주요 촉진요인 중 하나입니다. 중국은 초고압 HVDC 인프라에 대한 전략적 투자를 통해 국가 송전망의 효율성을 높이고, 재생에너지 발전이 풍부한 지역과 전력 소비가 많은 지역 간의 균형 잡힌 에너지 배분을 보장함으로써 주도권을 쥐고 있습니다.
세계 HVDC 케이블 시장을 형성하는 주요 기업으로는 Gupta Power Infrastructure Limited, Prysmian Group, TELE-FONIKA Kable S.A., Brugg Kabel AG, Nexans, ILJIN ELECTRIC, ZMS CABLE, Riyadh Cables, ZTT, Elcowire GROUP AB, Furukawa Electric, NKT A/S, Tratos, Mitsubishi Electric Corporation, Sumitomo Electric Industries, Sumitomo Electric Industries. ZMS CABLE,Riyadh Cables,ZTT,Elcowire GROUP AB,Furukawa Electric,NKT A/S,Tratos,Mitsubishi Electric Corporation,Sumitomo Electric Industries,. Ltd.,LS Cable &System Ltd.,Hitachi Energy Ltd.,Qingdao Hanhe Cable Co., Ltd.,Alfanar Group,Taihan Cable &Solution Co. 등이 있습니다.
HVDC 케이블 시장에서 사업을 전개하는 기업들은 해상, 지중, 초장거리 용도에 맞는 첨단 대용량 케이블 솔루션을 개발하기 위해 연구개발에 많은 투자를 하고 있으며, 이를 통해 입지를 강화하고 있습니다. 일부 기업은 대규모 송전 프로젝트를 확보하기 위해 에너지 사업자 및 EPC 기업과 전략적 파트너십을 맺고 있습니다. 또한, 맞춤형 케이블 시스템에 대한 수요 증가에 대응하기 위해 제조 능력을 확장하고 제조 기술을 업그레이드하는 기업도 있습니다. 경쟁력을 유지하기 위해 주요 벤더들은 탄소 발자국을 줄이고 재활용 가능한 재료를 사용하여 케이블을 제조함으로써 지속가능성에 초점을 맞추었습니다.
목차
제1장 조사 방법과 범위
제2장 주요 요약
제3장 업계 인사이트
- 업계 생태계 분석
- 규제 상황
- 업계에 대한 영향요인
- 성장 촉진요인
- 업계의 잠재적 리스크와 과제
- 가격 동향 분석(USD/km)
- 인스톨 별
- 지역별
- 성장 가능성 분석
- Porter의 Five Forces 분석
- 공급 기업의 교섭력
- 바이어의 교섭력
- 신규 진출업체의 위협
- 대체품의 위협
- PESTEL 분석
제4장 경쟁 구도
- 서론
- 기업의 시장 점유율 분석 : 지역별
- 북미
- 유럽
- 아시아태평양
- 전략적 이니셔티브
- 경쟁 벤치마킹
- 전략적 대시보드
- 혁신과 기술 상황
제5장 시장 규모와 예측 : 전압별, 2021년-2034년
- 주요 동향
- High (35 kV to 475 kV)
- Extra high (> 475 kV to 600 kV)
- Ultra-high (> 600 kV)
제6장 시장 규모와 예측 : 설비별, 2021년-2034년
- 주요 동향
- 가공
- 해저
- 지하
제7장 시장 규모와 예측 : 용도별, 2021년-2034년
- 주요 동향
- 역내
- 국경간
- 기타
제8장 시장 규모와 예측 : 지역별, 2021년-2034년
- 주요 동향
- 북미
- 미국
- 캐나다
- 유럽
- 독일
- 영국
- 이탈리아
- 덴마크
- 노르웨이
- 아시아태평양
- 중국
- 일본
- 인도
- 태국
- 인도네시아
- 세계 기타 지역
- 사우디아라비아
- 아랍에미리트(UAE)
- 남아프리카공화국
- 브라질
제9장 기업 개요
- Alfanar Group
- Brugg Kabel AG
- Elcowire GROUP AB
- Furukawa Electric
- Gupta Power Infrastructure Limited
- Hitachi Energy Ltd.
- ILJIN ELECTRIC
- LS Cable &System Ltd.
- Mitsubishi Electric Corporation
- Nexans
- NKT A/S
- Prysmian Group
- Qingdao Hanhe Cable Co., Ltd.
- Sumitomo Electric Industries, Ltd.
- Riyadh Cables
- Taihan Cable &Solution Co., Ltd.
- TELE-FONIKA Kable S.A.
- Tratos
- ZMS CABLE
- ZTT
The Global HVDC Cables Market was valued at USD 9.6 billion in 2024 and is estimated to grow at a CAGR of 24.3% to reach USD 59.9 billion by 2034. This exceptional growth is being fueled by a worldwide push for sustainable energy infrastructure. As governments and energy providers focus on integrating renewable sources into the grid, HVDC cable systems are emerging as critical tools for efficient, long-distance power transmission. With the ability to minimize energy loss and offer stable transmission across vast areas, these cables are increasingly adopted in modern, low-carbon electricity networks. The transition toward decarbonized energy is reshaping power transmission strategies, boosting investments in advanced HVDC technology.
A major factor accelerating this demand is the continued development of offshore wind farms. As wind projects move farther offshore and turbine capacities increase, the need for durable and high-performance power delivery systems has intensified. HVDC cables are becoming the go-to solution for transmitting electricity from these offshore facilities to onshore grids. Additionally, interconnection and cross-border grid initiatives are gaining traction as countries seek to enhance energy security by sharing electricity via transnational links. HVDC technology's ability to manage energy flow precisely makes it indispensable in these grid projects.
| Market Scope | |
|---|---|
| Start Year | 2024 |
| Forecast Year | 2025-2034 |
| Start Value | $9.6 Billion |
| Forecast Value | $59.9 Billion |
| CAGR | 24.3% |
The 35 kW to 475 kW segment is forecast to grow at a CAGR of 23% through 2034, as the global focus on energy connectivity and high-capacity infrastructure grows stronger. The market with voltage ranges from 35 kW to 475 kW are becoming more widely adopted due to their critical role in bulk power transmission. These cables are ideal for transferring electricity from large renewable sources located in remote areas, including hydropower stations and offshore wind platforms.
The underground segment is expected to grow at a CAGR of 16% by 2034, due to its compatibility with complex terrains and urban expansion zones. The underground HVDC cables see increased demand as urban and industrial regions prioritize space-saving, low-impact power transmission systems. These systems offer practical alternatives to overhead lines in congested or environmentally sensitive locations.
Asia Pacific HVDC Cables Market will reach USD 8 billion by 2034. Rising urban development, higher energy demands, and renewable energy integration are among the major drivers shaping this regional market. China leads the charge with strategic investments in ultra-high-voltage HVDC infrastructure to enhance national grid efficiency and ensure balanced energy distribution between areas rich in renewable generation and those with elevated electricity consumption.
Key companies shaping the Global HVDC Cables Market include Gupta Power Infrastructure Limited, Prysmian Group, TELE-FONIKA Kable S.A., Brugg Kabel AG, Nexans, ILJIN ELECTRIC, ZMS CABLE, Riyadh Cables, ZTT, Elcowire GROUP AB, Furukawa Electric, NKT A/S, Tratos, Mitsubishi Electric Corporation, Sumitomo Electric Industries, Ltd., LS Cable & System Ltd., Hitachi Energy Ltd., Qingdao Hanhe Cable Co., Ltd., Alfanar Group, and Taihan Cable & Solution Co., Ltd.
Companies operating in the HVDC Cables Market are strengthening their positions by investing heavily in R&D to develop advanced, high-capacity cable solutions tailored for offshore, underground, and ultra-long-distance applications. Several players are entering strategic partnerships with energy utilities and EPC firms to secure large-scale transmission projects. Some firms are also expanding their manufacturing capacities and upgrading production technologies to support the growing demand for customized cable systems. To stay competitive, key vendors are focusing on sustainability by producing cables with reduced carbon footprints and recyclable materials.
Table of Contents
Chapter 1 Methodology & Scope
- 1.1 Research design
- 1.2 Base estimates & calculations
- 1.3 Forecast calculation
- 1.4 Data sources
- 1.4.1 Primary
- 1.4.2 Secondary
- 1.4.2.1 Paid
- 1.4.2.2 Public
- 1.5 Market definitions
Chapter 2 Executive Summary
- 2.1 Industry synopsis, 2021 - 2034
Chapter 3 Industry Insights
- 3.1 Industry ecosystem analysis
- 3.2 Regulatory landscape
- 3.3 Industry impact forces
- 3.3.1 Growth drivers
- 3.3.2 Industry pitfalls & challenges
- 3.4 Price trend analysis (USD/km)
- 3.4.1 By installation
- 3.4.2 By region
- 3.5 Growth potential analysis
- 3.6 Porter's analysis
- 3.6.1 Bargaining power of suppliers
- 3.6.2 Bargaining power of buyers
- 3.6.3 Threat of new entrants
- 3.6.4 Threat of substitutes
- 3.7 PESTEL analysis
- 3.7.1 Political factors
- 3.7.2 Economic factors
- 3.7.3 Social factors
- 3.7.4 Technology factors
- 3.7.5 environmental factors
- 3.7.6 Legal factors
Chapter 4 Competitive landscape, 2024
- 4.1 Introduction
- 4.2 Company market share analysis, by region, 2024
- 4.2.1 North America
- 4.2.2 Europe
- 4.2.3 Asia Pacific
- 4.3 Strategic initiative
- 4.4 Competitive benchmarking
- 4.5 Strategic dashboard
- 4.6 Innovation & technology landscape
Chapter 5 Market Size and Forecast, By Voltage, 2021 - 2034 (km, USD Billion)
- 5.1 Key trends
- 5.2 High (35 kV to 475 kV)
- 5.3 Extra high (> 475 kV to 600 kV)
- 5.4 Ultra-high (> 600 kV)
Chapter 6 Market Size and Forecast, By Installation, 2021 - 2034 (km, USD Billion)
- 6.1 Key trends
- 6.2 Overhead
- 6.3 Submarine
- 6.4 Underground
Chapter 7 Market Size and Forecast, By Application, 2021 - 2034 (km, USD Billion)
- 7.1 Key trends
- 7.2 Intra-regional
- 7.3 Cross border
- 7.4 Others
Chapter 8 Market Size and Forecast, By Region, 2021 - 2034 (km, USD Billion)
- 8.1 Key trends
- 8.2 North America
- 8.2.1 U.S.
- 8.2.2 Canada
- 8.3 Europe
- 8.3.1 Germany
- 8.3.2 UK
- 8.3.3 Italy
- 8.3.4 Denmark
- 8.3.5 Norway
- 8.4 Asia Pacific
- 8.4.1 China
- 8.4.2 Japan
- 8.4.3 India
- 8.4.4 Thailand
- 8.4.5 Indonesia
- 8.5 Rest of the World
- 8.5.1 Saudi Arabia
- 8.5.2 UAE
- 8.5.3 South Africa
- 8.5.4 Brazil
Chapter 9 Company Profiles
- 9.1 Alfanar Group
- 9.2 Brugg Kabel AG
- 9.3 Elcowire GROUP AB
- 9.4 Furukawa Electric
- 9.5 Gupta Power Infrastructure Limited
- 9.6 Hitachi Energy Ltd.
- 9.7 ILJIN ELECTRIC
- 9.8 LS Cable & System Ltd.
- 9.9 Mitsubishi Electric Corporation
- 9.10 Nexans
- 9.11 NKT A/S
- 9.12 Prysmian Group
- 9.13 Qingdao Hanhe Cable Co., Ltd.
- 9.14 Sumitomo Electric Industries, Ltd.
- 9.15 Riyadh Cables
- 9.16 Taihan Cable & Solution Co., Ltd.
- 9.17 TELE-FONIKA Kable S.A.
- 9.18 Tratos
- 9.19 ZMS CABLE
- 9.20 ZTT