|
시장보고서
상품코드
1741000
산업용 배전반 시장 : 시장 기회, 성장 촉진요인, 산업 동향 분석 및 예측(2025-2034년)Industrial Distribution Panel Market Opportunity, Growth Drivers, Industry Trend Analysis, and Forecast 2025 - 2034 |
||||||
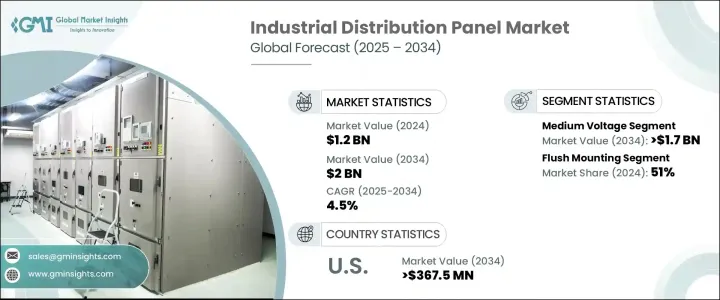
세계의 산업용 배전반 시장 규모는 2024년에 12억 달러로 평가되었고, 자동화 제어 시스템과 스마트 에너지 관리 기술의 채용 가속에 의해 CAGR 4.5%로 성장할 전망이며, 2034년에는 20억 달러에 이를 것으로 추정됩니다.
제조업, 인프라, 에너지 부문의 투자 증가가 보다 안전하고 효율적인 배전 솔루션 수요에 박차를 가하고 있습니다. 산업의 현대화가 진행됨에 따라 실시간 감시, 사전 유지보수, 에너지 최적화 강화를 제공하는 통합된 디지털 대응 패널에 대한 신뢰가 높아지고 있습니다. 스마트 그리드 기술의 진보 및 신재생 에너지 통합의 세계적 추진이 맞물려 산업용 배전반의 정세는 크게 변하고 있습니다. 시장은 또한 산업 자동화의 급증, 도시화 프로젝트, 에너지 효율 향상을 위한 규제 압력으로부터 혜택을 받고 있습니다. 하이브리드 전원과의 매끄러운 통합이 가능한 맞춤형 모듈식 시스템에 대한 산업계의 요구는 점점 높아지고 있으며, 산업용 배전반 분야는 장기적으로 지속적인 성장을 이루는 위치에 있습니다.
시장 역학은 진화하는 안전 규제, 급속한 기술 혁신, 보다 강인한 인프라의 필요성에 큰 영향을 받고 있습니다. 기업은 디지털 모니터링 도구를 기존 패널에 통합하여 최종 사용자에게 더 나은 성능 가시성과 운영 중단 시간의 절감을 제공하고 있습니다. 디지털 전환이 격화되는 가운데, 경쟁 환경은 격화일로를 걷고 있습니다. 주요 기업들은 세계적인 사업 전개와 기술력 강화를 위한 전략을 적극적으로 추진하고 있습니다. 기존 기업은 M&A를 활용해 신시장 진입, 전문기술 도입, 서비스 포트폴리오 확충을 꾀하고 있습니다. 신제품 개발에서는, 모듈 구성을 우선하는 것으로, 보다 신속한 설치나, 다양한 운용 요건에 대응하기 위한 커스터마이즈를 용이하게 하고 있습니다.
| 시장 범위 | |
|---|---|
| 시작 연도 | 2024년 |
| 예측 연도 | 2025-2034년 |
| 시작 금액 | 12억 달러 |
| 예측 금액 | 20억 달러 |
| CAGR | 4.5% |
시장의 새로운 동향의 중심은 디지털 인터페이스를 통한 지속적인 시스템 모니터링과 프로액티브 유지 보수를 지원하는 실시간 진단입니다. 이 진화는 시스템 성능을 대폭 향상시켜 다운타임을 최소화합니다. 또 하나의 큰 개발은, 신재생 에너지 관리 기능을 패널 시스템에 통합해, 태양광, 풍력, 하이브리드 전원을 원활하게 짜 넣는 것을 가능하게 하는 것입니다.
중전압 분야는 스마트 그리드 기술과 실시간 에너지 관리를 위한 자동화 시스템 도입에 힘입어 2034년까지 17억 달러를 창출할 것으로 예측되고 있습니다. 또, 지속 가능성을 중시하는 경향이 강해지고 있어 이산화탄소 배출량의 삭감에 도움이 되는 그린 스위치 기어 솔루션의 대두도 촉진하고 있습니다. 한편, 신흥국에서는 산업이나 인프라 활동이 활발해지고 있어 신뢰성이 높고 효율적인 고압 배전반의 요구가 더욱 높아지고 있습니다.
플래시 마운트 부문은 2024년에 51%의 점유율을 차지했으며, 2034년까지 연평균 복합 성장률(CAGR) 5%를 보일 것으로 예측됩니다. 벽면에 원활하게 맞추어 공간을 절약하는 플래시 마운트 패널은 최신의 상업 및 주택 설계로 점점 선호되고 있습니다. 소재나 모듈 설계의 혁신으로, 설치나 유지보수의 적응성이 한층 더 높아지고 있습니다. 설치가 간단하고 비용 면에서도 유리한 표면 실장 패널은 높은 접근성과 견고한 기능을 필요로 하는 산업 환경에 여전히 이상적입니다.
미국의 산업용 배전반 2024년 시장 규모는 2억 5,860만 달러로 평가되었고, 2034년에는 3억 6,750만 달러에 이를 것으로 예측됩니다. 인텔리전트 기술, 에너지 효율화 대책, 신재생 에너지원의 채용 확대가 시장을 견인하고 있습니다. IoT, 자동화, 모듈식 시스템의 도입은 공간 이용과 업무 효율을 극대화하고, 더 나아가 기술 혁신과 지속 가능한 개발에 초점을 맞춘 유리한 정부 정책에 의해 뒷받침되고 있습니다.
세계의 산업용 배전반 시장에서 사업을 전개하고 있는 주요 기업으로는 ABB, Eaton, General Electric, Legrand, Schneider Electric, Siemens, Hager Group 및 Larsen & Toubro Limited 등이 있습니다. 이 회사들은 제품 혁신, M&A, 세계 전개 등 전략적 이니셔티브를 통해 시장에서의 입지를 강화하고 있습니다. 예를 들어 슈나이더 일렉트릭은 에너지 관리 능력을 높이기 위해 배전반에 고급 디지털 솔루션을 통합하고, 이튼은 업무 효율성을 향상시키고 지속가능성 목표를 지원하기 위해 스마트 배전 기술에 많은 투자를 하고 있습니다. 이러한 전략적 노력으로 각 회사는 시장의 진화하는 수요에 대응하고 경쟁 우위를 유지할 수 있게 되었습니다.
목차
제1장 조사 방법 및 범위
제2장 주요 요약
제3장 업계 인사이트
- 생태계 분석
- 트럼프 정권의 관세 분석
- 무역에 미치는 영향
- 무역량의 혼란
- 보복 조치
- 업계에 미치는 영향
- 공급측의 영향(원재료)
- 주요 원재료의 가격 변동
- 공급망 재구성
- 생산 비용에 미치는 영향
- 수요측의 영향(판매가격)
- 최종 시장에 대한 가격 전달
- 시장 점유율 동향
- 소비자의 반응 패턴
- 공급측의 영향(원재료)
- 영향을 받는 주요 기업
- 전략적인 업계 대응
- 공급망 재구성
- 가격 설정 및 제품 전략
- 정책관여
- 전망 및 향후 검토 사항
- 무역에 미치는 영향
- 규제 상황
- 업계에 미치는 영향요인
- 성장 촉진요인
- 업계의 잠재적 위험 및 과제
- 성장 가능성 분석
- Porter's Five Forces 분석
- PESTEL 분석
제4장 경쟁 구도
- 전략적 대시보드
- 혁신 및 지속가능성의 정세
제5장 시장 규모 및 예측 : 전압별(2021-2034년)
- 주요 동향
- 저전압
- 중전압
제6장 시장 규모 및 예측 : 설치별(2021-2034년)
- 주요 동향
- 플래시 마운트
- 표면 실장
제7장 시장 규모 및 예측 : 최종 용도별(2021-2034년)
- 주요 동향
- 발전
- 화학약품
- 정유소
- 시멘트
- 기타
제8장 시장 규모 및 예측 : 지역별(2021-2034년)
- 주요 동향
- 북미
- 미국
- 캐나다
- 유럽
- 영국
- 프랑스
- 독일
- 러시아
- 이탈리아
- 아시아태평양
- 중국
- 호주
- 인도
- 일본
- 한국
- 중동 및 아프리카
- 사우디아라비아
- 아랍에미리트(UAE)
- 카타르
- 남아프리카
- 이집트
- 라틴아메리카
- 브라질
- 아르헨티나
- 멕시코
제9장 기업 프로파일
- ABB
- Ags
- alfanar Group
- CSE Solutions Pvt. Ltd.
- EAMFCO
- Eaton
- ESL POWER SYSTEMS, INC.
- General Electric
- Hager Group
- INDUSTRIAL ELECTRIC MFG
- Larsen &Toubro Limited
- Legrand
- Meba Electric Co.,Ltd
- NHP
- Norelco
- Paneltronics
- RBaker
- Schneider Electric
- Siemens
- Symbiotic Systems
The Global Industrial Distribution Panel Market was valued at USD 1.2 billion in 2024 and is estimated to grow at a CAGR of 4.5% to reach USD 2 billion by 2034, driven by the accelerating adoption of automation control systems and smart energy management technologies. Rising investments across manufacturing, infrastructure, and energy sectors are fueling the demand for safer, more efficient electrical distribution solutions. As industries continue to modernize, there is a growing reliance on integrated, digitally enabled panels that offer real-time monitoring, proactive maintenance, and enhanced energy optimization. Advancements in smart grid technology, coupled with a global push for renewable energy integration, are reshaping the landscape for industrial distribution panels. The market is also benefiting from a surge in industrial automation, urbanization projects, and regulatory pressures to boost energy efficiency. With industries increasingly demanding customized, modular systems that can seamlessly integrate with hybrid power sources, the industrial distribution panel sector is positioned for sustained long-term growth.

The market dynamics are heavily influenced by evolving safety regulations, rapid technological innovation, and the need for more resilient infrastructure. Companies are integrating digital monitoring tools into traditional panels, offering end-users better performance visibility and reduced operational downtime. As digital transformation intensifies, the competitive environment continues to heat up. Key players are aggressively pursuing strategies to expand their global footprint and enhance their technical capabilities. Established companies are leveraging mergers and acquisitions to access new markets, incorporate specialized technologies, and broaden their service portfolios. New product development is prioritizing modular configurations, enabling faster installation and easier customization to meet diverse operational requirements.
| Market Scope | |
|---|---|
| Start Year | 2024 |
| Forecast Year | 2025-2034 |
| Start Value | $1.2 Billion |
| Forecast Value | $2 Billion |
| CAGR | 4.5% |
Emerging trends in the market are centered around real-time diagnostics that support continuous system monitoring and proactive maintenance through digital interfaces. This evolution is significantly improving system performance and minimizing downtime. Another major development includes the integration of renewable energy management capabilities into panel systems, enabling seamless incorporation of solar, wind, or hybrid power sources.
The medium voltage segment is poised to generate USD 1.7 billion by 2034, propelled by the adoption of smart grid technologies and automated systems for real-time energy management. Growing emphasis on sustainability is also promoting the rise of green switchgear solutions that help reduce carbon emissions. Meanwhile, heightened industrial and infrastructure activities across developing countries are further accelerating the need for reliable and efficient medium-voltage distribution panels.
The flush mounting segment held a 51% share in 2024 and is anticipated to grow at a CAGR of 5% through 2034. Flush mounting panels, which fit seamlessly within walls and conserve space, are increasingly favored in modern commercial and residential designs. Innovations in materials and modular designs are further enhancing installation and maintenance adaptability. Surface mounting panels, offering ease of installation and cost benefits, remain ideal for industrial settings requiring high accessibility and robust functionality.
United States Industrial Distribution Panel Market generated USD 258.6 million in 2024 and is projected to reach USD 367.5 million by 2034. Expanding adoption of intelligent technologies, energy efficiency measures, and renewable energy sources is powering the market. The implementation of IoT, automation, and modular systems is maximizing space utilization and operational efficiency, further supported by favorable government policies focused on innovation and sustainable development.
Key companies operating in the Global Industrial Distribution Panel Market include ABB, Eaton, General Electric, Legrand, Schneider Electric, Siemens, Hager Group, and Larsen & Toubro Limited. These companies are strengthening their market positions through strategic initiatives such as product innovation, mergers and acquisitions, and global expansion. For example, Schneider Electric has integrated advanced digital solutions into its distribution panels to boost energy management capabilities, while Eaton has been heavily investing in smart distribution technologies to improve operational efficiency and support sustainability goals. These strategic efforts are enabling companies to meet the evolving demands of the market and maintain a competitive advantage.
Table of Contents
Chapter 1 Methodology & Scope
- 1.1 Market definitions
- 1.2 Base estimates & calculations
- 1.3 Forecast calculation
- 1.4 Data sources
- 1.4.1 Primary
- 1.4.2 Secondary
- 1.4.2.1 Paid
- 1.4.2.2 Public
Chapter 2 Executive Summary
- 2.1 Industry synopsis, 2021 - 2034
Chapter 3 Industry Insights
- 3.1 Industry ecosystem analysis
- 3.2 Trump administration tariff analysis
- 3.2.1 Impact on trade
- 3.2.1.1 Trade volume disruptions
- 3.2.1.2 Retaliatory measures
- 3.2.2 Impact on the industry
- 3.2.2.1 Supply-side impact (raw materials)
- 3.2.2.1.1 Price volatility in key materials
- 3.2.2.1.2 Supply chain restructuring
- 3.2.2.1.3 Production cost implications
- 3.2.2.2 Demand-side impact (selling price)
- 3.2.2.2.1 Price transmission to end markets
- 3.2.2.2.2 Market share dynamics
- 3.2.2.2.3 Consumer response patterns
- 3.2.2.1 Supply-side impact (raw materials)
- 3.2.3 Key companies impacted
- 3.2.4 Strategic industry responses
- 3.2.4.1 Supply chain reconfiguration
- 3.2.4.2 Pricing and product strategies
- 3.2.4.3 Policy engagement
- 3.2.5 Outlook and future considerations
- 3.2.1 Impact on trade
- 3.3 Regulatory landscape
- 3.4 Industry impact forces
- 3.4.1 Growth drivers
- 3.4.2 Industry pitfalls & challenges
- 3.5 Growth potential analysis
- 3.6 Porter's analysis
- 3.6.1 Bargaining power of suppliers
- 3.6.2 Bargaining power of buyers
- 3.6.3 Threat of new entrants
- 3.6.4 Threat of substitutes
- 3.7 PESTEL analysis
Chapter 4 Competitive landscape, 2024
- 4.1 Strategic dashboard
- 4.2 Innovation & sustainability landscape
Chapter 5 Market Size and Forecast, By Voltage, 2021 - 2034 (USD Million)
- 5.1 Key trends
- 5.2 Low voltage
- 5.3 Medium voltage
Chapter 6 Market Size and Forecast, By Mounting, 2021 - 2034 (USD Million)
- 6.1 Key trends
- 6.2 Flush mounting
- 6.3 Surface mounting
Chapter 7 Market Size and Forecast, By End Use, 2021 - 2034 (USD Million)
- 7.1 Key trends
- 7.2 Power generation
- 7.3 Chemical
- 7.4 Refinery
- 7.5 Cement
- 7.6 Others
Chapter 8 Market Size and Forecast, By Region, 2021 - 2034 (USD Million)
- 8.1 Key trends
- 8.2 North America
- 8.2.1 U.S.
- 8.2.2 Canada
- 8.3 Europe
- 8.3.1 UK
- 8.3.2 France
- 8.3.3 Germany
- 8.3.4 Russia
- 8.3.5 Italy
- 8.4 Asia Pacific
- 8.4.1 China
- 8.4.2 Australia
- 8.4.3 India
- 8.4.4 Japan
- 8.4.5 South Korea
- 8.5 Middle East & Africa
- 8.5.1 Saudi Arabia
- 8.5.2 UAE
- 8.5.3 Qatar
- 8.5.4 South Africa
- 8.5.5 Egypt
- 8.6 Latin America
- 8.6.1 Brazil
- 8.6.2 Argentina
- 8.6.3 Mexico
Chapter 9 Company Profiles
- 9.1 ABB
- 9.2 Ags
- 9.3 alfanar Group
- 9.4 CSE Solutions Pvt. Ltd.
- 9.5 EAMFCO
- 9.6 Eaton
- 9.7 ESL POWER SYSTEMS, INC.
- 9.8 General Electric
- 9.9 Hager Group
- 9.10 INDUSTRIAL ELECTRIC MFG
- 9.11 Larsen & Toubro Limited
- 9.12 Legrand
- 9.13 Meba Electric Co., Ltd
- 9.14 NHP
- 9.15 Norelco
- 9.16 Paneltronics
- 9.17 RBaker
- 9.18 Schneider Electric
- 9.19 Siemens
- 9.20 Symbiotic Systems