|
시장보고서
상품코드
1885922
그린 암모니아 시장 : 기회, 성장 요인, 업계 동향 분석 및 예측(2024-2032년)Green Ammonia Market Opportunity, Growth Drivers, Industry Trend Analysis, and Forecast 2024 - 2032 |
||||||
세계의 그린 암모니아 시장은 2024년에 5억 2,000만 달러로 평가되었고, 2034년까지 연평균 복합 성장률(CAGR)은 65.6%를 나타낼 것으로 예측되며 835억 달러로 성장할 전망입니다.

그린 암모니아는 글로벌 에너지 전환의 핵심 요소로 급부상하며, 수소 저장 가능성 확보, 재생에너지 연계, 해운과 같은 탈탄소화가 어려운 부문의 무탄소 연료 공급 등 에너지-화학 가치 사슬에서 중추적 역할을 수행하고 있습니다. 기존 암모니아 인프라를 활용해 규모 확대를 가속화하면서도 탈탄소화 목표를 달성할 수 있다는 점이 전략적 중요성입니다. 시장 성장은 지원적 정책 프레임워크, 기후 중립 목표, 그린 에너지 인증 제도에 힘입어 추진되고 있습니다. 특히 재생에너지 기반 전기분해 수소 생산 부문의 기술 발전은 비용 효율성과 운영 성능을 개선하고 있습니다. 에너지 대기업, 비료 생산업체, 해운 운영사의 기업적 약속은 투자를 더욱 촉진하며 그린 암모니아를 장기적 지속가능성 전략의 핵심 요소로 자리매김하고 있습니다. 지역별 동향은 아시아태평양 지역이 재생에너지 설비 용량 및 수출 프로젝트에서 선도하는 반면, 유럽은 규제 지원과 확립된 그린 수소 운송로(corridors)의 혜택을 받고 있음을 보여줍니다.
| 시장 범위 | |
|---|---|
| 시작 연도 | 2024년 |
| 예측 연도 | 2025-2034년 |
| 시작 금액 | 5억 2,000만 달러 |
| 예측 금액 | 835억 달러 |
| CAGR | 65.6% |
알칼리 수전해(AWE) 부문은 2024년 55.3%의 점유율을 기록했으며, 2034년까지 연평균 60.3%의 성장률을 보일 것으로 예상됩니다. AWE는 대규모 재생에너지 연계 프로젝트에 가장 비용 효율적이고 성숙한 기술로 남아 있습니다. 양자 교환막(PEM) 전기분해는 가변성 재생 전력에 대한 운영 유연성과 신속한 대응을 제공하여 계통 연계형 및 하이브리드 에너지 시스템에 이상적입니다.
비료 생산 부문은 2024년 44.2%의 점유율을 기록했으며, 2034년까지 연평균 복합 성장률(CAGR) 56.2%로 성장할 것으로 전망됩니다. 발효 기반 접근법은 바이오 플랫폼 화학물질 생산에 확립된 방식으로, 높은 선택성, 온화한 운영 조건, 대규모 복잡 분자 효율적 생산을 제공합니다.
북미의 그린 암모니아 시장은 2024년 25.9%의 점유율을 차지했습니다. 풍부한 재생에너지 자원, 지원 정책, 기존 암모니아 인프라가 저탄소 대안의 신속한 도입을 촉진함에 따라 해당 지역은 주요 생산 허브로 부상하고 있습니다.
자주 묻는 질문
목차
제1장 조사 방법과 범위
제2장 주요 요약
제3장 업계 인사이트
- 생태계 분석
- 공급자의 상황
- 이익률
- 각 단계의 부가가치
- 밸류체인에 영향을 주는 요인
- 혁신
- 업계에 미치는 영향요인
- 성장 촉진요인
- 세계의 탈탄소화 목표와 탄소중립 약속
- 해운업계의 탄소중립 연료 전환
- 정부 인센티브 및 보조금 프로그램
- 업계의 잠재적 위험 및 과제
- 고액의 자본 투자 요건
- 기술 성숙도 및 규모 확대 과제
- 시장 기회
- 기존 암모니아 생산 시설 개조
- 소규모 분산형 생산 시스템
- 성장 촉진요인
- 성장 가능성 분석
- 규제 상황
- 북미
- 유럽
- 아시아태평양
- 라틴아메리카
- 중동 및 아프리카
- Porter's Five Forces 분석
- PESTEL 분석
- 가격 동향
- 지역별
- 전해 장치 기술 유형별
- 장래 시장 동향
- 기술과 혁신 동향
- 현재의 기술 동향
- 신흥기술
- 특허 상황
- 무역 통계(HS코드)(참고 : 무역 통계는 주요 국가에서만 제공됨)
- 주요 수입국
- 주요 수출국
- 지속가능성과 환경면
- 지속가능한 대처
- 폐기물 감축 전략
- 생산의 에너지 효율
- 환경에 배려한 대처
- 탄소발자국 고려
제4장 경쟁 구도
- 소개
- 기업의 시장 점유율 분석
- 지역별
- 북미
- 유럽
- 아시아태평양
- 라틴아메리카
- 중동 및 아프리카
- 지역별
- 기업 매트릭스 분석
- 주요 시장 기업의 경쟁 분석
- 경쟁 포지셔닝 매트릭스
- 주요 발전
- 합병 및 인수
- 제휴 및 협업
- 신제품 발매
- 사업 확대 계획
제5장 시장 추계 및 예측 : 기술 유형별(2021-2034년)
- 주요 동향
- 알칼리 수전해(AWE)
- 양성자 교환막(PEM) 전해
- 고체 산화물 전해조 셀(SOEC)
- 음이온 교환막(AEM)
제6장 시장 추계 및 예측 : 용도별(2021-2034년)
- 주요 동향
- 비료 생산
- 선박연료 및 해운
- 수소 운송 및 저장
- 공업 원료 및 화학제품
- 발전 및 에너지 저장
제7장 시장 추계 및 예측 : 생산 방식별(2021-2034년)
- 주요 동향
- 현장/분산형 생산
- 중앙 집중형/대규모 생산
제8장 시장 추계 및 예측 : 지역별(2021-2034년)
- 주요 동향
- 북미
- 미국
- 캐나다
- 유럽
- 독일
- 영국
- 프랑스
- 스페인
- 이탈리아
- 기타 유럽
- 아시아태평양
- 중국
- 인도
- 일본
- 호주
- 한국
- 기타 아시아태평양
- 라틴아메리카
- 브라질
- 멕시코
- 아르헨티나
- 기타 라틴아메리카
- 중동 및 아프리카
- 사우디아라비아
- 남아프리카
- 아랍에미리트(UAE)
- 기타 중동 및 아프리카
제9장 기업 프로파일
- Siemens Energy
- ThyssenKrupp AG
- Nel ASA(Hydrogenics)
- Yara International
- Haldor Topsoe
- Air Products Inc
- BASF SE
- Hiringa Energy
- Hydrogenics
- Kapsom
- MAN Energy Solutions
- Starfire Energy
- Technip Energies NV
- Uniper ENGIE
The Global Green Ammonia Market was valued at USD 520 million in 2024 and is estimated to grow at a CAGR of 65.6% to reach USD 83.5 billion by 2034.
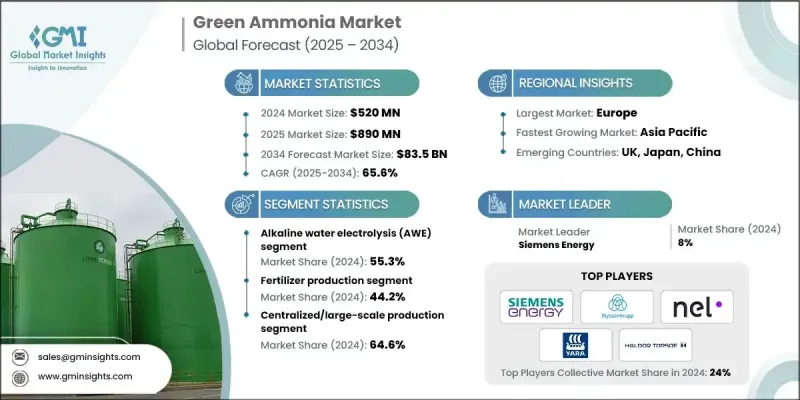
Green ammonia is rapidly emerging as a cornerstone of the global energy transition, playing a critical role in energy-chemical value chains by enabling hydrogen storage, coupling with renewable energy, and serving as a zero-carbon fuel for hard-to-decarbonize sectors such as shipping. Its strategic importance lies in leveraging existing ammonia infrastructure to accelerate scale-up while meeting decarbonization targets. Market growth is propelled by supportive policy frameworks, climate neutrality goals, and certification schemes for green energy. Technological advancements, particularly in electrolysis-based hydrogen production powered by renewables, are improving cost efficiency and operational performance. Corporate commitments from energy majors, fertilizer producers, and maritime operators are further driving investment, positioning green ammonia as a key element of long-term sustainability strategies. Regional trends indicate Asia-Pacific leading in renewable capacity and export projects, while Europe benefits from regulatory support and established green hydrogen corridors.
| Market Scope | |
|---|---|
| Start Year | 2024 |
| Forecast Year | 2025-2034 |
| Start Value | $520 Million |
| Forecast Value | $83.5 Billion |
| CAGR | 65.6% |
The alkaline water electrolysis (AWE) segment held a 55.3% share in 2024 and is expected to grow at a CAGR of 60.3% through 2034. AWE remains the most cost-effective and mature technology for large-scale renewable energy-linked projects. Proton exchange membrane (PEM) electrolysis offers operational flexibility and rapid response to variable renewable electricity, making it ideal for grid-tied and hybrid energy systems.
The fertilizer production segment held a 44.2% share in 2024 and is projected to grow at a CAGR of 56.2% by 2034. Fermentation-based approaches are well-established for producing bio-platform chemicals, offering high selectivity, mild operating conditions, and efficient production of complex molecules at scale.
North America Green Ammonia Market accounted for a 25.9% share in 2024. The region is emerging as a key production hub due to abundant renewable energy resources, supportive policies, and existing ammonia infrastructure that facilitates rapid adoption of low-carbon alternatives.
Major companies in the Global Green Ammonia Market include Yara International, Siemens Energy, BASF SE, Air Products Inc., Haldor Topsoe, MAN Energy Solutions, Starfire Energy, Technip Energies NV, ThyssenKrupp AG, Nel ASA (Hydrogenics), Hydrogenics, Kapsom, Hiringa Energy, and Uniper ENGIE. Market players are strengthening their position by investing in R&D to improve electrolysis efficiency and reduce production costs. They are forming strategic partnerships with renewable energy providers and industrial consumers to secure long-term offtake agreements. Companies are also exploring modular and large-scale production facilities to optimize logistics and infrastructure utilization. Integration of digital monitoring and advanced control systems is enhancing operational performance and reliability. Additionally, mergers, acquisitions, and joint ventures are being employed to expand geographic footprint, accelerate commercialization, and capture growing demand in both established and emerging green ammonia markets.
Table of Contents
Chapter 1 Methodology & Scope
- 1.1 Market scope and definition
- 1.2 Research design
- 1.2.1 Research approach
- 1.2.2 Data collection methods
- 1.3 Data mining sources
- 1.3.1 Global
- 1.3.2 Regional/Country
- 1.4 Base estimates and calculations
- 1.4.1 Base year calculation
- 1.4.2 Key trends for market estimation
- 1.5 Primary research and validation
- 1.5.1 Primary sources
- 1.6 Forecast model
- 1.7 Research assumptions and limitations
Chapter 2 Executive Summary
- 2.1 Industry 360° synopsis
- 2.2 Key market trends
- 2.2.1 Regional
- 2.2.2 Technology type
- 2.2.3 Application
- 2.2.4 Production mode
- 2.3 TAM Analysis, 2025-2034
- 2.4 CXO perspectives: Strategic imperatives
- 2.4.1 Executive decision points
- 2.4.2 Critical success factors
- 2.5 Future Outlook and Strategic Recommendations
Chapter 3 Industry Insights
- 3.1 Industry ecosystem analysis
- 3.1.1 Supplier landscape
- 3.1.2 Profit margin
- 3.1.3 Value addition at each stage
- 3.1.4 Factor affecting the value chain
- 3.1.5 Disruptions
- 3.2 Industry impact forces
- 3.2.1 Growth drivers
- 3.2.1.1 Global decarbonization targets & net-zero commitments
- 3.2.1.2 Maritime industry's transition to zero-carbon fuels
- 3.2.1.3 Government incentives & subsidy programs
- 3.2.2 Industry pitfalls and challenges
- 3.2.2.1 High capital investment requirements
- 3.2.2.2 Technological maturity & scale-up challenges
- 3.2.3 Market opportunities
- 3.2.3.1 Retrofitting existing ammonia production facilities
- 3.2.3.2 Small-scale distributed production systems
- 3.2.1 Growth drivers
- 3.3 Growth potential analysis
- 3.4 Regulatory landscape
- 3.4.1 North America
- 3.4.2 Europe
- 3.4.3 Asia Pacific
- 3.4.4 Latin America
- 3.4.5 Middle East & Africa
- 3.5 Porter's analysis
- 3.6 PESTEL analysis
- 3.7 Price trends
- 3.7.1 By region
- 3.7.2 By electrolyzer technology type
- 3.8 Future market trends
- 3.9 Technology and Innovation landscape
- 3.9.1 Current technological trends
- 3.9.2 Emerging technologies
- 3.10 Patent Landscape
- 3.11 Trade statistics (HS code) ( Note: the trade statistics will be provided for key countries only)
- 3.11.1 Major importing countries
- 3.11.2 Major exporting countries
- 3.12 Sustainability and environmental aspects
- 3.12.1 Sustainable practices
- 3.12.2 Waste reduction strategies
- 3.12.3 Energy efficiency in production
- 3.12.4 Eco-friendly initiatives
- 3.13 Carbon footprint consideration
Chapter 4 Competitive Landscape, 2024
- 4.1 Introduction
- 4.2 Company market share analysis
- 4.2.1 By region
- 4.2.1.1 North America
- 4.2.1.2 Europe
- 4.2.1.3 Asia Pacific
- 4.2.1.4 LATAM
- 4.2.1.5 MEA
- 4.2.1 By region
- 4.3 Company matrix analysis
- 4.4 Competitive analysis of major market players
- 4.5 Competitive positioning matrix
- 4.6 Key developments
- 4.6.1 Mergers & acquisitions
- 4.6.2 Partnerships & collaborations
- 4.6.3 New Product Launches
- 4.6.4 Expansion Plans
Chapter 5 Market Estimates and Forecast, By Technology Type, 2021-2034 (USD Million)
- 5.1 Key trends
- 5.2 Alkaline water electrolysis (AWE)
- 5.3 Proton exchange membrane (PEM) electrolysis
- 5.4 Solid oxide electrolyzer cell (SOEC)
- 5.5 Anion exchange membrane (AEM)
Chapter 6 Market Estimates and Forecast, By Application, 2021-2034 (USD Million)
- 6.1 Key trends
- 6.2 Fertilizer production
- 6.3 Maritime fuel & shipping
- 6.4 Hydrogen carrier & storage
- 6.5 Industrial feedstock & chemicals
- 6.6 Power generation & energy storage
Chapter 7 Market Estimates and Forecast, By Production Mode, 2021-2034 (USD Million)
- 7.1 Key trends
- 7.2 On-site/distributed production
- 7.3 Centralized/large-scale production
Chapter 8 Market Estimates and Forecast, By Region, 2021-2034 (USD Million)
- 8.1 Key trends
- 8.2 North America
- 8.2.1 U.S.
- 8.2.2 Canada
- 8.3 Europe
- 8.3.1 Germany
- 8.3.2 UK
- 8.3.3 France
- 8.3.4 Spain
- 8.3.5 Italy
- 8.3.6 Rest of Europe
- 8.4 Asia Pacific
- 8.4.1 China
- 8.4.2 India
- 8.4.3 Japan
- 8.4.4 Australia
- 8.4.5 South Korea
- 8.4.6 Rest of Asia Pacific
- 8.5 Latin America
- 8.5.1 Brazil
- 8.5.2 Mexico
- 8.5.3 Argentina
- 8.5.4 Rest of Latin America
- 8.6 Middle East and Africa
- 8.6.1 Saudi Arabia
- 8.6.2 South Africa
- 8.6.3 UAE
- 8.6.4 Rest of Middle East and Africa
Chapter 9 Company Profiles
- 9.1 Siemens Energy
- 9.2 ThyssenKrupp AG
- 9.3 Nel ASA (Hydrogenics)
- 9.4 Yara International
- 9.5 Haldor Topsoe
- 9.6 Air Products Inc
- 9.7 BASF SE
- 9.8 Hiringa Energy
- 9.9 Hydrogenics
- 9.10 Kapsom
- 9.11 MAN Energy Solutions
- 9.12 Starfire Energy
- 9.13 Technip Energies NV
- 9.14 Uniper ENGIE