


|
시장보고서
상품코드
1750603
전자 가솔린(E-가솔린) 시장 : 기회, 성장 촉진요인, 산업 동향 분석 및 예측(2025-2034년)E-Gasoline Market Opportunity, Growth Drivers, Industry Trend Analysis, and Forecast 2025 - 2034 |
||||||
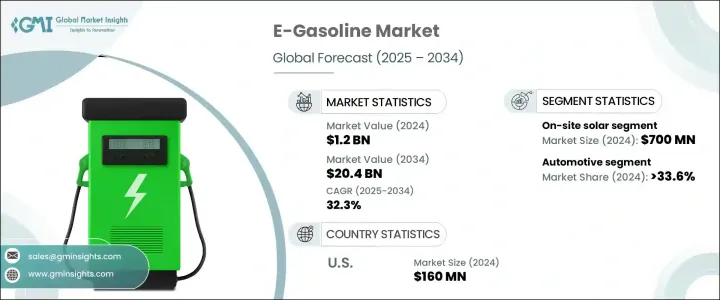
세계의 E-가솔린 시장 규모는 2024년에는 12억 달러로 평가되었고, 향후 점점 엄격해지는 배출규제와 지속가능한 대체연료에 대한 수요가 증가함에 따라 2034년에는 204억 달러에 달할 것으로 예측되며, CAGR 32.3%로 성장할 전망입니다.
정부가 환경 기준을 강화함에 따라 산업계는 청정 기술을 채택하며 친환경 솔루션인 전자 가솔린에 대한 수요가 증가하고 있습니다. 소비자들의 기후 변화에 대한 인식 향상과 저탄소 연료에 대한 프리미엄 지불 의향도 이 전환을 뒷받침하고 있습니다. 합성 연료인 전자 가솔린은 전통적인 화석 연료의 청정 대체재로 주목받고 있으며, 특히 교통 분야를 중심으로 온실가스 배출 감축에 기여하고 있습니다.
새로운 기술적 진보는 생산 비용을 낮추고 효율성을 향상시켜, 탄소 배출량을 줄이려는 기업과 소비자에게 E-가솔린이 더 실용적인 선택지로 부상하게 했습니다. 합성 연료 생산 방법의 개발은 E-가솔린이 더 효과적으로 확장될 수 있도록 하며, 에너지 기업들로부터 상당한 투자를 유치하고 있습니다. 자동차 산업과 에너지 산업 간의 협력은 E-가솔린 생산 및 유통 인프라 구축에 핵심적인 역할을 하며, 그 채택과 글로벌 연료 네트워크로의 통합을 가속화합니다. 또한 이러한 협업은 E-가솔린 기술 혁신을 효율화하여 연료의 안정적인 공급과 지속 가능한 에너지 수요 증가에 대응할 수 있도록 합니다.
| 시장 범위 | |
|---|---|
| 시작 연도 | 2024년 |
| 예측 연도 | 2025-2034년 |
| 시작금액 | 12억 달러 |
| 예측 금액 | 204억 달러 |
| CAGR | 32.3% |
풍력 에너지 부문은 정부와 기업들이 대규모 풍력 터빈 설치를 위한 노력을 강화함에 따라 청정하고 재생 가능한 에너지에 대한 수요가 가속화되어 2034년까지 CAGR이 33%에 달할 것으로 예상되며, 인상적인 성장을 달성할 준비가 되어 있습니다. 재생에너지 채택은 기후 변화 대응의 핵심 축으로 인식되고 있으며, 풍력 에너지는 자연 자원을 활용해 전기를 생산하는 가장 효율적인 방법 중 하나입니다. 터빈 설계 및 효율성 개선을 통한 기술적 진보는 풍력 에너지를 이전에는 적합하지 않았던 지역에서도 실현 가능하고 비용 효율적인 에너지로 만들고 있습니다.
2034년까지 32%의 CAGR이 예상되는 해양 부문은 더 엄격한 환경 규제를 준수하고 전체 온실가스 배출량을 줄이기 위해 적극적으로 노력하고 있습니다. EU의 FuelEU 해양 규정과 같은 이러한 규제는 해양 산업이 기존의 고배출 연료에서 E-가솔린, 수소, 암모니아와 같은 대체 연료로 전환하도록 장려합니다. 국제 해운은 전 세계 탄소 배출의 주요 원인이기 때문에, 특히 지속 가능성 정책이 엄격한 유럽에서 저탄소 연료에 대한 추진력이 탄력을 받고 있습니다.
유럽의 E-가솔린 시장은 2034년까지 연평균 30%의 성장률을 보일 것으로 예상되며, 탄소 중립 의무가 빠른 채택을 촉진할 것입니다. 유럽 그린 딜(European Green Deal)과 같은 주요 정책과 산업 협력은 자동차와 항공을 포함한 다양한 운송 수단의 지속 가능한 연료로의 전환을 가속화하고 있습니다. EU의 2030년 재생 에너지 목표는 고급 바이오 연료와 비생물학적 재생 연료(RFNBOs)에 상당한 비중을 할당함으로써 이 성장세를 더욱 강화하고 있습니다.
세계의 E-가솔린 시장의 주요 기업은 Arcadia eFuels, ExxonMobil, Ballard Power Systems, LanzaJet 등입니다. 많은 기업들은 E-가솔린 생산 과정의 효율성과 확장성을 개선하기 위해 연구개발(R&D)에 대규모 투자를 진행 중입니다. 또한 정부 및 산업 리더들과 협력해 광범위한 채택을 지원하기 위한 필수 인프라 구축을 추진하고 있습니다. 지속 가능성과 규제 준수라는 목표를 바탕으로, 이 기업들은 저탄소 에너지 미래의 핵심 플레이어로 자리매김하고 있습니다.
목차
제1장 조사 방법과 범위
제2장 주요 요약
제3장 산업 고찰
- 생태계 분석
- 트럼프 정권의 관세 분석
- 무역에 미치는 영향
- 무역량의 혼란
- 보복 조치
- 산업에 미치는 영향
- 공급측의 영향(원료)
- 주요 원료의 가격 변동
- 공급망 재구성
- 생산 비용에 미치는 영향
- 수요측의 영향(판매가격)
- 최종 시장에의 가격 전달
- 시장 점유율 동향
- 소비자의 반응 패턴
- 공급측의 영향(원료)
- 영향을 받는 주요 기업
- 전략적인 산업 대응
- 공급망 재구성
- 가격 설정 및 제품 전략
- 시책관여
- 무역에 미치는 영향
- 전망과 향후 검토 사항
- 산업에 미치는 영향요인
- 성장 촉진요인
- 산업의 잠재적 리스크 및 과제
- 성장 가능성 분석
- Porter's Five Forces 분석
- PESTEL 분석
제4장 경쟁 구도
- 소개
- 전략적 대시보드
- 전략적 노력
- 기업의 시장 점유율
- 경쟁 벤치마킹
- 혁신과 지속가능성의 정세
제5장 시장 규모와 예측 : 재생 에너지원별(2021-2034년)
- 주요 동향
- 현장 태양광 발전
- 풍력
제6장 시장 규모와 예측 : 기술별(2021-2034년)
- 주요 동향
- 피셔 및 트롭쉬
- eRWGS
- 기타
제7장 시장 규모와 예측 : 용도별(2021-2034년)
- 주요 동향
- 자동차
- 해양
- 항공
- 산업
- 기타
제8장 시장 규모와 예측 : 지역별(2021-2034년)
- 주요 동향
- 북미
- 미국
- 캐나다
- 유럽
- 독일
- 영국
- 프랑스
- 스페인
- 네덜란드
- 아시아태평양
- 중국
- 인도
- 일본
- 한국
- 호주
- 중동 및 아프리카
- 사우디아라비아
- 아랍에미리트(UAE)
- 남아프리카
- 라틴아메리카
- 브라질
- 아르헨티나
제9장 기업 프로파일
- Arcadia eFuels
- Archer Daniels Midland Co.
- Ballard Power Systems, Inc.
- Ceres Power Holding Plc
- Climeworks AG
- Clean Fuels Alliance America
- Electrochaea GmbH
- eFuel Pacific Limited
- ExxonMobil
- FuelCell Energy, Inc.
- HIF Global
- INFRA Synthetic Fuels, Inc.
- Liquid Wind
- LanzaJet
- MAN Energy Solutions
- Norsk E-Gasoline AS
- Porsche
- Sunfire GmbH
The Global E-Gasoline Market was valued at USD 1.2 billion in 2024 and is estimated to grow at a CAGR of 32.3% to reach USD 20.4 billion by 2034, driven by increasingly stringent emission regulations and a rising demand for sustainable fuel alternatives. As governments enforce stricter environmental standards, industries adopt cleaner technologies, pushing the demand for eco-friendly solutions like e-gasoline. Consumers' growing awareness of climate change and willingness to pay a premium for low-carbon fuels also support this shift. E-gasoline, as a synthetic fuel, is gaining traction as a cleaner alternative to traditional fossil fuels, aiding in reducing greenhouse gas emissions across various sectors, particularly transportation.

New technological advancements have led to lower production costs and improved efficiency, making e-gasoline a more practical choice for businesses and consumers aiming to lower their carbon footprint. The development of synthetic fuel production methods is enabling e-gasoline to scale more effectively, drawing substantial investments from energy companies. Partnerships between the automotive and energy industries play a key role in building infrastructure for e-gasoline production and distribution, accelerating its adoption and integration into global fuel networks. Additionally, these collaborations help streamline innovation in e-gasoline technology, ensuring that the fuel is readily available and meets the growing demand for sustainable energy sources.
| Market Scope | |
|---|---|
| Start Year | 2024 |
| Forecast Year | 2025-2034 |
| Start Value | $1.2 Billion |
| Forecast Value | $20.4 Billion |
| CAGR | 32.3% |
The wind energy sector is poised for impressive growth, with expectations for a CAGR of 33% by 2034 driven by the accelerating demand for clean, renewable energy, as governments and corporations ramp up efforts to install large-scale wind turbines. Renewable energy adoption is now seen as a key pillar in tackling climate change, and wind energy is one of the most efficient ways to harness natural resources to produce electricity. Technological improvements in turbine design and efficiency make wind power more viable and cost-effective, even in previously unsuitable locations.
The maritime segment, with a projected CAGR of 32% through 2034, is actively working to comply with stricter environmental regulations and reduce its overall greenhouse gas emissions. These regulations, such as the EU's FuelEU Maritime Regulation, encourage the maritime industry to move away from traditional high-emission fuels and shift to alternative options like e-gasoline, hydrogen, and ammonia. As international shipping is a major contributor to global carbon emissions, the push for low-carbon fuels is gaining momentum, particularly in Europe, where sustainability policies are stringent.
Europe E-Gasoline Market is expected to grow at a CAGR of 30% through 2034, with carbon-neutral mandates driving rapid adoption. Key policies like the European Green Deal and industry collaborations are accelerating the transition to sustainable fuels for various transportation modes, including cars and aviation. The EU's binding renewable energy targets for 2030, which include a significant share for advanced biofuels and renewable fuels of non-biological origin (RFNBOs), further reinforce this growth.
Leading players in the Global E-Gasoline Market include Arcadia eFuels, ExxonMobil, Ballard Power Systems, and LanzaJet. These companies are focusing on strategic partnerships, technological advancements, and scaling production to strengthen their position in the market. Many of these players are also investing heavily in R&D to improve the efficiency and scalability of e-gasoline production processes. In addition, they are working closely with governments and other industry leaders to ensure that the necessary infrastructure is in place to support widespread adoption. With sustainability and regulatory compliance, these companies are positioning themselves as key players in a low-carbon energy future.
Table of Contents
Chapter 1 Methodology & Scope
- 1.1 Market definition
- 1.2 Base estimates & calculations
- 1.3 Forecast calculation
- 1.4 Data source
- 1.4.1 Primary
- 1.4.2 Secondary
- 1.4.2.1 Paid
- 1.4.2.2 Public
Chapter 2 Executive Summary
- 2.1 Industry synopsis, 2021 - 2034
Chapter 3 Industry Insights
- 3.1 Industry ecosystem analysis
- 3.2 Trump administration tariffs analysis
- 3.2.1 Impact on trade
- 3.2.1.1 Trade volume disruptions
- 3.2.1.2 Retaliatory measures
- 3.2.2 Impact on the industry
- 3.2.2.1 Supply-side impact (raw materials)
- 3.2.2.1.1 Price volatility in key materials
- 3.2.2.1.2 Supply chain restructuring
- 3.2.2.1.3 Production cost implications
- 3.2.2.2 Demand-side impact (selling price)
- 3.2.2.2.1 Price transmission to end markets
- 3.2.2.2.2 Market share dynamics
- 3.2.2.2.3 Consumer response patterns
- 3.2.2.1 Supply-side impact (raw materials)
- 3.2.3 Key companies impacted
- 3.2.4 Strategic industry responses
- 3.2.4.1 Supply chain reconfiguration
- 3.2.4.2 Pricing and product strategies
- 3.2.4.3 Policy engagement
- 3.2.1 Impact on trade
- 3.3 Outlook and future considerations
- 3.4 Industry impact forces
- 3.4.1 Growth drivers
- 3.4.2 Industry pitfalls & challenges
- 3.5 Growth potential analysis
- 3.6 Porter's analysis
- 3.6.1 Bargaining power of suppliers
- 3.6.2 Bargaining power of buyers
- 3.6.3 Threat of new entrants
- 3.6.4 Threat of substitutes
- 3.7 PESTEL analysis
Chapter 4 Competitive landscape, 2024
- 4.1 Introduction
- 4.2 Strategic dashboard
- 4.3 Strategic initiative
- 4.4 Company market share
- 4.5 Competitive benchmarking
- 4.6 Innovation & sustainability landscape
Chapter 5 Market Size and Forecast, By Renewable Source, 2021 - 2034 (USD Billion)
- 5.1 Key trends
- 5.2 On-site solar
- 5.3 Wind
Chapter 6 Market Size and Forecast, By Technology, 2021 - 2034 (USD Billion)
- 6.1 Key trends
- 6.2 Fischer-tropsch
- 6.3 eRWGS
- 6.4 Others
Chapter 7 Market Size and Forecast, By Application, 2021 - 2034 (USD Billion)
- 7.1 Key trends
- 7.2 Automotive
- 7.3 Marine
- 7.4 Aviation
- 7.5 Industrial
- 7.6 Others
Chapter 8 Market Size and Forecast, By Region, 2021 - 2034 (USD Billion)
- 8.1 Key trends
- 8.2 North America
- 8.2.1 U.S.
- 8.2.2 Canada
- 8.3 Europe
- 8.3.1 Germany
- 8.3.2 UK
- 8.3.3 France
- 8.3.4 Spain
- 8.3.5 Netherlands
- 8.4 Asia Pacific
- 8.4.1 China
- 8.4.2 India
- 8.4.3 Japan
- 8.4.4 South Korea
- 8.4.5 Australia
- 8.5 Middle East & Africa
- 8.5.1 Saudi Arabia
- 8.5.2 UAE
- 8.5.3 South Africa
- 8.6 Latin America
- 8.6.1 Brazil
- 8.6.2 Argentina
Chapter 9 Company Profiles
- 9.1 Arcadia eFuels
- 9.2 Archer Daniels Midland Co.
- 9.3 Ballard Power Systems, Inc.
- 9.4 Ceres Power Holding Plc
- 9.5 Climeworks AG
- 9.6 Clean Fuels Alliance America
- 9.7 Electrochaea GmbH
- 9.8 eFuel Pacific Limited
- 9.9 ExxonMobil
- 9.10 FuelCell Energy, Inc.
- 9.11 HIF Global
- 9.12 INFRA Synthetic Fuels, Inc.
- 9.13 Liquid Wind
- 9.14 LanzaJet
- 9.15 MAN Energy Solutions
- 9.16 Norsk E-Gasoline AS
- 9.17 Porsche
- 9.18 Sunfire GmbH


