|
시장보고서
상품코드
1740993
가스 연료 화관 화학 보일러 시장 : 시장 기회, 촉진요인, 산업 동향 분석 및 예측(2025-2034년)Gas Fueled Fire Tube Chemical Boiler Market Opportunity, Growth Drivers, Industry Trend Analysis, and Forecast 2025 - 2034 |
||||||
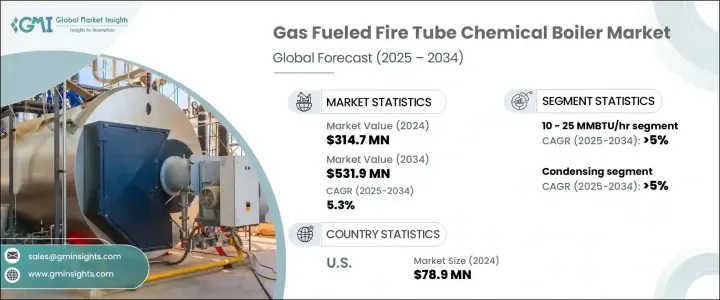
세계의 가스 연료 화관 화학 보일러 시장은 2024년 3억 1,470만 달러로 평가되었고, CAGR 5.3%로 성장할 전망이며, 2034년에는 5억 3,190만 달러에 이를 것으로 예측되고 있습니다.
이러한 성장의 주요 요인은 보다 깨끗하고 효율적인 에너지 시스템에 대한 수요가 세계적으로 증가하고 있다는 것입니다. 산업계가 지속 가능한 사업으로의 이행을 계속하는 가운데, 저배출 및 고효율을 지원하는 고도의 보일러 기술 채용이 대폭 증가하고 있습니다. 신흥 경제국을 중심으로 한 공업화의 진전은, 에너지 인프라 정비의 새로운 길을 열어, 고성능 화학 보일러의 수요를 한층 더 끌어올리고 있습니다.

오늘날의 산업 상황에서 에너지 효율은 더 이상 옵션이 아니며 전략적으로 필요한 것입니다. 기업은 컴플라이언스 기준을 충족하기 위해서뿐만 아니라 장기적인 비용 절감과 탁월한 운영을 실현하기 위해서도 보일러 시스템의 현대화에 투자하고 있습니다. 환경 규제는 세계적으로 강화되고 있으며, 기업들은 이산화탄소 배출량을 줄일 필요가 있습니다. 그 결과 지속적인 RandD, 디지털 통합, 에너지 절약 기술 혁신에 힘입어 가스 연료 화관 화학 보일러 시장은 빠르게 진화하고 있습니다. 이 보일러들은 연료 소비와 배출을 최소화하면서 화학 처리에 신뢰성 높은 스팀과 열원을 제공합니다. 산업계가 스마트 오퍼레이션을 중시하게 됨에 따라 디지털 제어와 예지보전 기술의 통합이 시장 도입의 중요한 촉진 요인이 되고 있습니다. 세계 시장 전망에서는 에너지 효율 촉진을 목적으로 한 정부 정책이 지속 가능한 에너지 관행에 대한 소비자 의식의 고조와 맞물려 향후 10년간 꾸준한 시장 확대의 무대를 갖추고 있습니다.
| 시장 범위 | |
|---|---|
| 시작 연도 | 2024년 |
| 예측 연도 | 2025-2034년 |
| 시작 금액 | 3억 1,470만 달러 |
| 예측 금액 | 5억 3,190만 달러 |
| CAGR | 5.3% |
시장의 호조로운 궤도는 에너지 효율적인 기술의 사용을 촉진하는 엄격한 환경 규제에 의해 더욱 지원되고 있습니다. 현재 많은 산업이 기존 보일러 시스템을 배출량을 줄이고 열전달 효율을 향상시키도록 설계된 최신 유닛으로 업그레이드하고 있습니다. 디지털 전환이 산업 프로세스 전반에 침투함에 따라 기업들은 원격 감시, 실시간 진단, 자동 성능 최적화를 제공하는 인텔리전트 보일러 솔루션에 주목하고 있습니다. 이러한 진화는 신뢰성을 높일 뿐만 아니라, 기기의 수명을 늘리고, 다운타임을 줄이고, 유지보수 비용을 삭감합니다.
지속 가능한 난방 솔루션의 추진은 콘덴싱 가스를 연료로 하는 화관 화학 보일러의 강한 수요도 창출해 왔으며, 2034년까지 연평균 복합 성장률(CAGR) 5%에서 안정적인 성장이 예상됩니다. 이러한 보일러는 에너지 절약과 배출 제어를 향상시켜 에너지 비용을 높이고 환경 정책을 강화하는 산업에 매력적인 선택입니다. 응축 기술은 배기가스에서 잠열을 회수하기 때문에 기존 보일러에 비해 효율이 크게 향상됩니다. 에너지 효율적인 시스템 구매를 지원하는 정부의 우대조치 및 리베이트가 지속되고 있기 때문에 콘덴싱 모델로 전환하는 기업이 늘어날 것으로 예상됩니다.
용량 10-25 MMBTU/hr의 부문은 중소규모 화학 플랜트에 적합하기 때문에 CAGR 5%로 확대될 것으로 예측됩니다. 이 부문은 이러한 보일러가 제공하는 유연성과 작동 효율로 인해 수요가 급증하고 있습니다. 정기적인 유지보수가 필요한 기존 시스템과 달리 이러한 보일러는 상태 기반 유지보수가 가능하며 플랜트 운영자가 필요에 따라 유닛을 유지보수할 수 있습니다. 이 접근 방식은 계획 밖의 정지를 줄이고 시스템의 신뢰성을 높여 전체적인 기기 수명을 늘리는 것으로 운전 최적화와 총 소유 비용 절감을 목표로 하는 기업에 중요한 이점이 됩니다.
미국의 가스 연료 화관 화학 보일러 시장은 2024년에 7,890만 달러를 창출했으며, 고효율 시스템의 채용을 장려하는 유리한 정부 프로그램에 뒷받침되고 있습니다. 연방 및 주 차원의 우대 조치, 세액 공제, 리베이트 제도가 더 많은 산업 시설에 최신 보일러 기술로의 이행을 촉구하고 있습니다. 게다가 보일러 설계와 에너지 관리의 진보와 맞물려 이 나라에서 진행중인 인프라 근대화의 대처가, 이 지역 전체의 시장 성장을 촉진하는데 있어서 중요한 역할을 하고 있습니다.
세계의 가스 연료 화관 화학 보일러 시장의 주요 기업은 Babcock Wanson, Bosch Industriekessel, Hurst Boiler and Welding, Cleaver-Brooks, Viessmann, Rentech Boiler Systems, Thermax 등이 있습니다. 이러한 기업은 제품 혁신에 대한 투자, 고효율 모델 개발, 전략적 제휴 체결 등으로 시장에서의 존재감을 강화하고 있습니다. 이들 기업은 세계의 지속가능성 목표를 따르면서 특히 고성장 지역의 세계발자국 확대에 주력하고 있습니다. 정부가 지원하는 에너지 프로그램을 활용해 기술 포트폴리오를 지속적으로 개선함으로써 이들 업체는 친환경 산업용 가열 솔루션으로의 시프트 고조에 대응할 수 있는 체제를 갖추고 있습니다.
목차
제1장 조사 방법 및 범위
제2장 주요 요약
제3장 업계 인사이트
- 생태계 분석
- 트럼프 정권의 관세 분석
- 무역에 미치는 영향
- 무역량의 혼란
- 보복조치
- 업계에 미치는 영향
- 공급측의 영향(원재료)
- 주요 원재료의 가격 변동
- 공급망 재구성
- 생산 비용에 미치는 영향
- 수요측의 영향(판매가격)
- 최종 시장에 대한 가격 전달
- 시장 점유율 동향
- 소비자의 반응 패턴
- 공급측의 영향(원재료)
- 영향을 받는 주요 기업
- 전략적인 업계 대응
- 공급망 재구성
- 가격 설정 및 제품 전략
- 정책관여
- 전망 및 향후 검토 사항
- 무역에 미치는 영향
- 규제 상황
- 업계에 미치는 영향요인
- 성장 촉진요인
- 업계의 잠재적 위험 및 과제
- 성장 가능성 분석
- Porter's Five Forces 분석
- PESTEL 분석
제4장 경쟁 구도
- 서문
- 전략적 전망
- 혁신 및 지속가능성의 정세
제5장 시장 규모 및 예측 : 용량별(2021-2034년)
- 주요 동향
- 10 MMBTU/시 미만
- 10-25 MMBTU/시
- 25-50 MMBTU/시
- 50-75 MMBTU/시
- 75-100 MMBTU/시
- 100-175 MMBTU/시
- 175-250 MMBTU/시
- 250 MMBTU/시 이상
제6장 시장 규모 및 예측 : 기술별(2021-2034년)
- 주요 동향
- 응축
- 불응축
제7장 시장 규모 및 예측 : 지역별(2021-2034년)
- 주요 동향
- 북미
- 미국
- 캐나다
- 멕시코
- 유럽
- 프랑스
- 영국
- 폴란드
- 이탈리아
- 스페인
- 오스트리아
- 독일
- 스웨덴
- 러시아
- 아시아태평양
- 중국
- 인도
- 필리핀
- 일본
- 한국
- 호주
- 인도네시아
- 중동 및 아프리카
- 사우디아라비아
- 이란
- 아랍에미리트(UAE)
- 나이지리아
- 남아프리카
- 라틴아메리카
- 아르헨티나
- 칠레
- 브라질
제8장 기업 프로파일
- ALFA LAVAL
- Applied Control
- Ariston Holding
- Babcock Wanson
- Bosch Industriekessel
- Clayton Industries
- Cleaver-Brooks
- Cochran
- EPCB Boiler
- Forbes Marshall
- Hurst Boiler &Welding
- Miura America
- Rentech Boiler Systems
- Ross Boilers
- Thermax
- Thermodyne Boilers
- Viessmann
- Zhengzhou Boiler Group
The Global Gas-Fueled Fire Tube Chemical Boiler Market was valued at USD 314.7 million in 2024 and is estimated to grow at a CAGR of 5.3% to reach USD 531.9 million by 2034. This growth is primarily fueled by the rising demand for cleaner and more efficient energy systems across the globe. As industries continue to transition toward sustainable operations, the adoption of advanced boiler technologies that support lower emissions and higher efficiency is seeing a significant upswing. Increasing industrialization, especially in emerging economies, is creating new avenues for energy infrastructure development, further boosting the demand for high-performance chemical boilers.
In today's industrial landscape, energy efficiency is no longer optional-it's a strategic necessity. Companies are investing in modernizing their boiler systems not only to meet compliance standards but also to achieve long-term cost savings and operational excellence. Environmental regulations are tightening worldwide, and businesses are under growing pressure to reduce their carbon footprint. As a result, the market for gas-fueled fire tube chemical boilers is evolving rapidly, backed by continuous RandD, digital integration, and energy-saving innovations. These boilers offer a reliable source of steam and heat for chemical processing while minimizing fuel consumption and emissions. As industries focus more on smart operations, the integration of digital controls and predictive maintenance technologies is becoming a key driver of market adoption. From a global perspective, government policies aimed at promoting energy efficiency, coupled with increasing consumer awareness of sustainable energy practices, are setting the stage for steady market expansion over the next decade.
| Market Scope | |
|---|---|
| Start Year | 2024 |
| Forecast Year | 2025-2034 |
| Start Value | $314.7 Million |
| Forecast Value | $531.9 Million |
| CAGR | 5.3% |
The market's positive trajectory is further supported by strict environmental regulations that promote the use of energy-efficient technologies. Many industries are now upgrading their legacy boiler systems with modern units designed to reduce emissions and improve heat transfer efficiency. As digital transformation takes hold across industrial processes, businesses are turning to intelligent boiler solutions that offer remote monitoring, real-time diagnostics, and automated performance optimization. These advancements not only enhance reliability but also extend the lifespan of equipment, reduce downtime, and lower maintenance costs.
The push for sustainable heating solutions is also creating strong demand for condensing gas-fueled fire tube chemical boilers, which are expected to grow steadily at a CAGR of 5% through 2034. These boilers offer superior energy conservation and emissions control, making them an attractive choice for industries facing rising energy costs and increasingly stringent environmental policies. Condensing technology captures latent heat from exhaust gases, significantly boosting efficiency compared to traditional boilers. With government incentives and rebates continuing to support the purchase of energy-efficient systems, more businesses are expected to make the switch to condensing models.
The 10-25 MMBTU/hr capacity segment is projected to expand at a 5% CAGR, driven by its suitability for small to mid-sized chemical plants. This segment is seeing a surge in demand due to the flexibility and operational efficiency these boilers offer. Unlike conventional systems that require servicing at regular intervals, these boilers enable condition-based maintenance, allowing plant operators to service units as needed. This approach reduces unplanned outages, enhances system reliability, and extends overall equipment life-key benefits for companies aiming to optimize operations and reduce total cost of ownership.
The U.S. Gas-Fueled Fire Tube Chemical Boiler Market generated USD 78.9 million in 2024, supported by favorable government programs that encourage the adoption of high-efficiency systems. Federal and state-level incentives, tax credits, and rebate programs are pushing more industrial facilities to transition to modern boiler technologies. In addition, the country's ongoing infrastructure modernization efforts, paired with advancements in boiler design and energy management, are playing a vital role in driving market growth across the region.
Leading players in the Global Gas-Fueled Fire Tube Chemical Boiler Market include Babcock Wanson, Bosch Industriekessel, Hurst Boiler and Welding, Cleaver-Brooks, Viessmann, Rentech Boiler Systems, and Thermax. These companies are strengthening their market presence by investing in product innovation, developing high-efficiency models, and entering strategic collaborations. They are focusing on expanding their global footprint, especially in high-growth regions, while aligning with global sustainability goals. By leveraging government-backed energy programs and continually improving their technology portfolios, these manufacturers are positioning themselves to capitalize on the growing shift toward eco-friendly industrial heating solutions.
Table of Contents
Chapter 1 Methodology & Scope
- 1.1 Research design
- 1.2 Market estimates & forecast parameters
- 1.3 Forecast calculation
- 1.4 Data sources
- 1.4.1 Primary
- 1.4.2 Secondary
- 1.4.2.1 Paid
- 1.4.2.2 Public
- 1.5 Market definitions
Chapter 2 Executive Summary
- 2.1 Industry synopsis, 2021 - 2034
Chapter 3 Industry Insights
- 3.1 Industry ecosystem analysis
- 3.2 Trump administration tariffs analysis
- 3.2.1 Impact on trade
- 3.2.1.1 Trade volume disruptions
- 3.2.1.2 Retaliatory measures
- 3.2.2 Impact on the industry
- 3.2.2.1 Supply-side impact (raw material)
- 3.2.2.1.1 Price volatility in key materials
- 3.2.2.1.2 Supply chain restructuring
- 3.2.2.1.3 Production cost implications
- 3.2.2.2 Demand-side impact (selling price)
- 3.2.2.2.1 Price transmission to end markets
- 3.2.2.2.2 Market share dynamics
- 3.2.2.2.3 Consumer response patterns
- 3.2.2.1 Supply-side impact (raw material)
- 3.2.3 Key companies impacted
- 3.2.4 Strategic industry responses
- 3.2.4.1 Supply chain reconfiguration
- 3.2.4.2 Pricing and product strategies
- 3.2.4.3 Policy engagement
- 3.2.5 Outlook and future considerations
- 3.2.1 Impact on trade
- 3.3 Regulatory landscape
- 3.4 Industry impact forces
- 3.4.1 Growth drivers
- 3.4.2 Industry pitfalls & challenges
- 3.5 Growth potential analysis
- 3.6 Porter's analysis
- 3.6.1 Bargaining power of suppliers
- 3.6.2 Bargaining power of buyers
- 3.6.3 Threat of new entrants
- 3.6.4 Threat of substitutes
- 3.7 PESTEL analysis
Chapter 4 Competitive Landscape, 2025
- 4.1 Introduction
- 4.2 Strategic outlook
- 4.3 Innovation & sustainability landscape
Chapter 5 Market Size and Forecast, By Capacity, 2021 – 2034 (Units, MMBTU/hr & USD Million)
- 5.1 Key trends
- 5.2 < 10 MMBTU/hr
- 5.3 10 - 25 MMBTU/hr
- 5.4 25 - 50 MMBTU/hr
- 5.5 50 - 75 MMBTU/hr
- 5.6 75 - 100 MMBTU/hr
- 5.7 100 - 175 MMBTU/hr
- 5.8 175 - 250 MMBTU/hr
- 5.9 > 250 MMBTU/hr
Chapter 6 Market Size and Forecast, By Technology, 2021 – 2034 (Units, MMBTU/hr & USD Million)
- 6.1 Key trends
- 6.2 Condensing
- 6.3 Non-condensing
Chapter 7 Market Size and Forecast, By Region, 2021 – 2034 (Units, MMBTU/hr & USD Million)
- 7.1 Key trends
- 7.2 North America
- 7.2.1 U.S.
- 7.2.2 Canada
- 7.2.3 Mexico
- 7.3 Europe
- 7.3.1 France
- 7.3.2 UK
- 7.3.3 Poland
- 7.3.4 Italy
- 7.3.5 Spain
- 7.3.6 Austria
- 7.3.7 Germany
- 7.3.8 Sweden
- 7.3.9 Russia
- 7.4 Asia Pacific
- 7.4.1 China
- 7.4.2 India
- 7.4.3 Philippines
- 7.4.4 Japan
- 7.4.5 South Korea
- 7.4.6 Australia
- 7.4.7 Indonesia
- 7.5 Middle East & Africa
- 7.5.1 Saudi Arabia
- 7.5.2 Iran
- 7.5.3 UAE
- 7.5.4 Nigeria
- 7.5.5 South Africa
- 7.6 Latin America
- 7.6.1 Argentina
- 7.6.2 Chile
- 7.6.3 Brazil
Chapter 8 Company Profiles
- 8.1 ALFA LAVAL
- 8.2 Applied Control
- 8.3 Ariston Holding
- 8.4 Babcock Wanson
- 8.5 Bosch Industriekessel
- 8.6 Clayton Industries
- 8.7 Cleaver-Brooks
- 8.8 Cochran
- 8.9 EPCB Boiler
- 8.10 Forbes Marshall
- 8.11 Hurst Boiler & Welding
- 8.12 Miura America
- 8.13 Rentech Boiler Systems
- 8.14 Ross Boilers
- 8.15 Thermax
- 8.16 Thermodyne Boilers
- 8.17 Viessmann
- 8.18 Zhengzhou Boiler Group