
|
시장보고서
상품코드
1913309
가공 과일 및 채소 시장 예측 : 기회, 성장 요인, 업계 동향 분석(2026-2035년)Processed Fruits and Vegetables Market Opportunity, Growth Drivers, Industry Trend Analysis, and Forecast 2026 - 2035 |
||||||
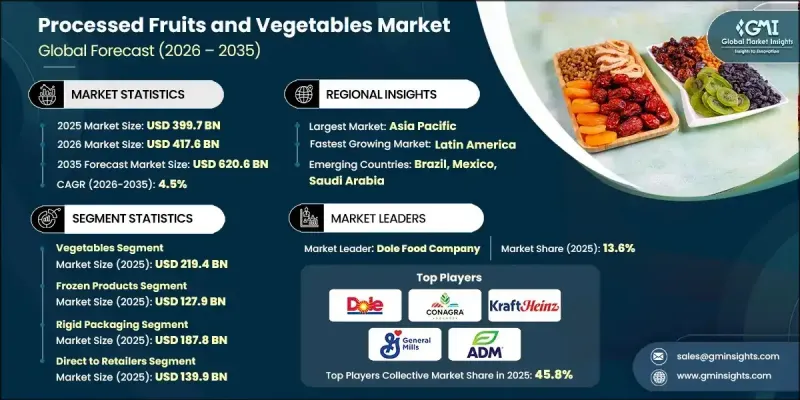
세계 가공 과일 및 채소 시장은 2025년에 3,997억 달러로 평가되었으며, 2035년까지 연평균 복합 성장률(CAGR) 4.5%로 성장하여 6,206억 달러에 이를 것으로 예측됩니다.

성장을 뒷받침하는 것은 일상 식사에서 편의성과 시간 효율을 중시하는 소비 패턴의 변화입니다. 도시화, 노동시간의 연장, 가구 구조의 변화에 의해 식사의 준비에 충당되는 시간이 감소를 계속하고 있어, 즉석 식품 및 즉석 식품 옵션 수요가 높아지고 있습니다. 가공 과일 및 채소는 보존 기간의 연장, 품질의 안정성, 다양한 소비 장면에서의 간편함 등의 이점에 의해 이러한 요구에 부응하고 있습니다. 동시에, 영양과 균형 잡힌 식단에 대한 의식 증가는 가공 농산물에 대한 소비자의 호의적인 인식을 지원합니다. 많은 소비자들은 영양가가 유지되면 이러한 제품을 신선한 대안을 대체하는 실용적인 대안으로 간주합니다. 최소한의 가공을 실시한 형태, 냉동제품, 식물성 식품을 중시한 식습관의 수용이 진행됨으로써, 소비자층이 퍼져 소매 및 외식산업 채널에서의 장기적인 시장 확대가 강화되고 있습니다.
| 시장 범위 | |
|---|---|
| 시작 연도 | 2025년 |
| 예측 연도 | 2026-2035년 |
| 시작 금액 | 3,997억 달러 |
| 예측 금액 | 6,206억 달러 |
| CAGR | 4.5% |
야채 카테고리는 2025년 2,194억 달러 시장 규모를 창출했습니다. 야채는 가정, 외식산업, 산업식품생산에 있어서 폭넓은 이용으로 가공 과일 및 채소 시장에서 주요 제품군을 차지하고 있습니다. 보존 기간이 길고, 과일에 비해 천연 당분이 적은 것, 그리고 세계의 요리에 적응할 수 있는 것이, 견고하고 안정된 수요를 지지하고 있습니다.
냉동 형태 부문은 2025년에 1,279억 달러를 차지하며, 가공 유형 중 주도적인 점유율을 유지하고 있습니다. 이러한 제품은 영양가, 식감, 풍미를 유지하면서 보존 기간을 연장할 수 있는 점이 높게 평가되어 상업 용도와 소비자용도를 모두 지지하고 있습니다.
북미 가공 과일 및 채소 시장은 2025년에 23%의 점유율을 차지하고 있으며, 고급 가공 기술, 견고한 콜드체인 인프라, 엄격한 식품 안전 기준에 뒷받침됩니다. 미국은 대규모 제조거점, 1인당 가공 식품 소비량이 많고, 발달한 소매 및 외식산업 네트워크를 통해 지역 생산을 선도하고 있습니다.
자주 묻는 질문
목차
제1장 조사 방법과 범위
제2장 주요 요약
제3장 업계 인사이트
- 생태계 분석
- 공급업체 현황
- 수익률
- 각 단계에서의 부가가치
- 밸류체인에 영향을 주는 요인
- 혁신
- 업계에 미치는 영향요인
- 성장 촉진요인
- 편의식품에 대한 소비자 수요 증가
- 높아지는 건강과 웰빙에 대한 관심
- 조직화된 소매업 및 전자상거래의 확대
- 업계의 잠재적 위험 및 과제
- 계절성 원재료에 대한 높은 의존도
- 엄격한 식품안전 및 품질규제
- 시장 기회
- 식물 유래 제품 및 기능성 제품에의 전개
- 현지 생산이 제한된 지역으로의 수출 가능성
- 성장 촉진요인
- 성장 가능성 분석
- 규제 상황
- 북미
- 유럽
- 아시아태평양
- 라틴아메리카
- 중동 및 아프리카
- Porter's Five Forces 분석
- PESTEL 분석
- 가격 동향
- 지역별
- 제품 유형
- 향후 시장 동향
- 기술과 혁신 동향
- 현재의 기술 동향
- 신규기술
- 특허 상황
- 무역 통계(HS코드)(참고: 무역 통계는 주요 국가에 대해서만 제공됨.)
- 주요 수입국
- 주요 수출국
- 지속가능성과 환경면
- 지속가능한 대처
- 폐기물 감축 전략
- 생산에 있어서의 에너지 효율
- 친환경 이니셔티브
- 탄소발자국에 관한 고려 사항
제4장 경쟁 구도
- 소개
- 기업의 시장 점유율 분석
- 지역별
- 북미
- 유럽
- 아시아태평양
- 라틴아메리카
- 중동 및 아프리카
- 지역별
- 기업 매트릭스 분석
- 주요 시장 기업의 경쟁 분석
- 경쟁 포지셔닝 매트릭스
- 주요 발전
- 합병 및 인수
- 제휴 및 협업
- 신제품 발매
- 확대 계획
제5장 시장 추정 및 예측 : 제품 유형별, 2022-2035
- 과일
- 감귤류
- 베리류
- 핵과류
- 열대과일
- 기타 과일
- 야채
- 잎채소 및 십자화과 채소
- 뿌리채소 및 구근류
- 기타 야채
제6장 시장 추정 및 예측 : 가공 형태별, 2022-2035
- 통조림 및 병조림 제품
- 냉동제품
- 건조 및 탈수 제품
- 신선 컷/최소 가공
- 주스 및 농축액
- 잼 젤리류
- 퓨레 및 소스
- 기타
제7장 시장 추정 및 예측 : 포장 유형별, 2022-2035
- 경질 포장
- 금속캔
- 유리병
- 경질 플라스틱 용기
- 연질 포장
- 스탠드업 파우치
- 레토르트 파우치
- 봉투, 필름 및 랩
- 벌크 포장
- 드럼캔 및 페일캔
- 톤백(Totes) 및 IBC 용기
- 무균 대량 용기
- 기타
제8장 시장 추정 및 예측 : 유통채널별, 2022-2035
- 온라인 플랫폼
- 소매점에 직접 판매
- 도매업체
- 기타
제9장 시장 추정 및 예측 : 지역별, 2022-2035
- 북미
- 미국
- 캐나다
- 유럽
- 독일
- 영국
- 프랑스
- 스페인
- 이탈리아
- 기타 유럽
- 아시아태평양
- 중국
- 인도
- 일본
- 호주
- 한국
- 기타 아시아태평양
- 라틴아메리카
- 브라질
- 멕시코
- 기타 라틴아메리카
- 중동 및 아프리카
- 사우디아라비아
- 남아프리카
- 아랍에미리트(UAE)
- 기타 중동 및 아프리카
제10장 기업 프로파일
- Dole Food Company
- Conagra Brands, Inc.
- Del Monte Foods, Inc.
- Nestle SA
- The Kraft Heinz Company
- General Mills, Inc.
- B&G Foods, Inc.
- ADM
- ABC Fruits
- Conagra
- Vebzy Nature
- Grofresh Agrofoods Pvt Ltd
The Global Processed Fruits and Vegetables Market was valued at USD 399.7 billion in 2025 and is estimated to grow at a CAGR of 4.5% to reach USD 620.6 billion by 2035.
Growth is supported by changing consumption patterns that favor convenience and time efficiency in daily meals. Urbanization, longer working schedules, and evolving household structures continue to reduce time available for food preparation, strengthening demand for ready-to-use and ready-to-eat food options. Processed fruits and vegetables address these needs by offering extended shelf life, consistent quality, and ease of use across multiple consumption settings. At the same time, rising awareness of nutrition and balanced diets is supporting positive consumer perception of processed produce. Many consumers now view these products as practical alternatives to fresh options when nutritional value is preserved. Growing acceptance of minimally processed formats, frozen offerings, and plant-forward eating habits is widening the consumer base and reinforcing long-term market expansion across retail and foodservice channels.
| Market Scope | |
|---|---|
| Start Year | 2025 |
| Forecast Year | 2026-2035 |
| Start Value | $399.7 Billion |
| Forecast Value | $620.6 Billion |
| CAGR | 4.5% |
The vegetables category generated USD 219.4 billion in 2025. Vegetables represent the dominant product group within the processed fruits and vegetables market due to broad utilization across households, foodservice operations, and industrial food production. Their longer storage potential, lower natural sugar content compared to fruits, and adaptability across global cuisines contribute to strong and consistent demand.
The frozen formats segment accounted for USD 127.9 billion in 2025, holding a leading share within processing types. These products are favored for their ability to preserve nutritional content, texture, and taste while offering extended storage life, supporting both commercial and consumer use.
North America Processed Fruits and Vegetables Market held 23% share in 2025, supported by advanced processing capabilities, robust cold-chain infrastructure, and strong food safety standards. The United States leads regional production due to a large manufacturing base, high per-capita consumption of convenience foods, and well-developed retail and foodservice networks.
Key companies active in the Global Processed Fruits and Vegetables Market include Nestle S.A., Dole Food Company, The Kraft Heinz Company, General Mills, Inc., Del Monte Foods, Inc., Conagra Brands, Inc., B&G Foods, Inc., ADM, Grofresh Agrofoods Pvt Ltd, Vebzy Nature and ABC Fruits. Companies operating in the Global Processed Fruits and Vegetables Market strengthen their position through product innovation, supply chain efficiency, and geographic expansion. Leading players invest in processing technologies that maintain nutritional integrity while improving shelf stability. Portfolio diversification across formats and price points helps address varied consumer preferences. Firms also focus on sourcing optimization and long-term partnerships with growers to ensure consistent raw material supply. Expansion into emerging markets, along with enhanced distribution networks, supports volume growth.
Table of Contents
Chapter 1 Methodology & Scope
- 1.1 Market scope and definition
- 1.2 Research design
- 1.2.1 Research approach
- 1.2.2 Data collection methods
- 1.3 Data mining sources
- 1.3.1 Global
- 1.3.2 Regional/Country
- 1.4 Base estimates and calculations
- 1.4.1 Base year calculation
- 1.4.2 Key trends for market estimation
- 1.5 Primary research and validation
- 1.5.1 Primary sources
- 1.6 Forecast model
- 1.7 Research assumptions and limitations
Chapter 2 Executive Summary
- 2.1 Industry 360° synopsis
- 2.2 Key market trends
- 2.2.1 Regional
- 2.2.2 Product Type
- 2.2.3 Processing Form
- 2.2.4 Packaging Type
- 2.2.5 Distribution Channel
- 2.3 TAM Analysis, 2026-2035
- 2.4 CXO perspectives: Strategic imperatives
- 2.4.1 Executive decision points
- 2.4.2 Critical success factors
- 2.5 Future Outlook and Strategic Recommendations
Chapter 3 Industry Insights
- 3.1 Industry ecosystem analysis
- 3.1.1 Supplier Landscape
- 3.1.2 Profit Margin
- 3.1.3 Value addition at each stage
- 3.1.4 Factor affecting the value chain
- 3.1.5 Disruptions
- 3.2 Industry impact forces
- 3.2.1 Growth drivers
- 3.2.1.1 Rising consumer demand for convenience foods
- 3.2.1.2 Growing health & wellness consciousness
- 3.2.1.3 Expansion of organized retail & e-commerce
- 3.2.2 Industry pitfalls and challenges
- 3.2.2.1 High Dependency on Seasonal Raw Materials
- 3.2.2.2 Stringent Food Safety and Quality Regulations
- 3.2.3 Market opportunities
- 3.2.3.1 Expansion into Plant-Based and Functional Products
- 3.2.3.2 Export potential to regions with limited local production
- 3.2.1 Growth drivers
- 3.3 Growth potential analysis
- 3.4 Regulatory landscape
- 3.4.1 North America
- 3.4.2 Europe
- 3.4.3 Asia Pacific
- 3.4.4 Latin America
- 3.4.5 Middle East & Africa
- 3.5 Porter's analysis
- 3.6 PESTEL analysis
- 3.7 Price trends
- 3.7.1 By region
- 3.7.2 Product Type
- 3.8 Future market trends
- 3.9 Technology and Innovation Landscape
- 3.9.1 Current technological trends
- 3.9.2 Emerging technologies
- 3.10 Patent Landscape
- 3.11 Trade statistics (HS code) (Note: the trade statistics will be provided for key countries only)
- 3.11.1 Major importing countries
- 3.11.2 Major exporting countries
- 3.12 Sustainability and environmental aspects
- 3.12.1 Sustainable practices
- 3.12.2 Waste reduction strategies
- 3.12.3 Energy efficiency in production
- 3.12.4 Eco-friendly initiatives
- 3.13 Carbon footprint considerations
Chapter 4 Competitive Landscape, 2025
- 4.1 Introduction
- 4.2 Company market share analysis
- 4.2.1 By region
- 4.2.1.1 North America
- 4.2.1.2 Europe
- 4.2.1.3 Asia Pacific
- 4.2.1.4 LATAM
- 4.2.1.5 MEA
- 4.2.1 By region
- 4.3 Company matrix analysis
- 4.4 Competitive analysis of major market players
- 4.5 Competitive positioning matrix
- 4.6 Key developments
- 4.6.1 Mergers & acquisitions
- 4.6.2 Partnerships & collaborations
- 4.6.3 New product launches
- 4.6.4 Expansion plans
Chapter 5 Market Estimates and Forecast, By Product Type, 2022 - 2035 (USD Billion) (Kilo Tons)
- 5.1 Key trends
- 5.2 Fruits
- 5.2.1 Citrus fruits
- 5.2.2 Berries
- 5.2.3 Stone fruits
- 5.2.4 Tropical fruits
- 5.2.5 Other fruits
- 5.3 Vegetables
- 5.3.1 Leafy & cruciferous vegetables
- 5.3.2 Root & bulb vegetables
- 5.3.3 Other vegetables
Chapter 6 Market Estimates and Forecast, By Processing Form, 2022 - 2035 (USD Billion) (Kilo Tons)
- 6.1 Key trends
- 6.2 Canned / jarred products
- 6.3 Frozen products
- 6.4 Dried & dehydrated
- 6.5 Fresh-cut / minimally processed
- 6.6 Juices & concentrates
- 6.7 Preserves, jams & jellies
- 6.8 Purees & sauces
- 6.9 Others
Chapter 7 Market Estimates and Forecast, By Packaging Type, 2022 - 2035 (USD Billion) (Kilo Tons)
- 7.1 Key trends
- 7.2 Rigid packaging
- 7.2.1 Metal cans
- 7.2.2 Glass jars
- 7.2.3 Rigid plastic containers
- 7.3 Flexible packaging
- 7.3.1 Stand-up pouches
- 7.3.2 Retort pouches
- 7.3.3 Bags, films & wraps
- 7.4 Bulk packaging
- 7.4.1 Drums & pails
- 7.4.2 Totes & IBC containers
- 7.4.3 Aseptic bulk containers
- 7.5 Others
Chapter 8 Market Estimates and Forecast, By Distribution Channel, 2022 - 2035 (USD Billion) (Kilo Tons)
- 8.1 Key trends
- 8.2 Online platforms
- 8.3 Direct to retailers
- 8.4 Wholesalers
- 8.5 Others
Chapter 9 Market Estimates and Forecast, By Region, 2022 - 2035 (USD Billion) (Kilo Tons)
- 9.1 Key trends
- 9.2 North America
- 9.2.1 U.S.
- 9.2.2 Canada
- 9.3 Europe
- 9.3.1 Germany
- 9.3.2 UK
- 9.3.3 France
- 9.3.4 Spain
- 9.3.5 Italy
- 9.3.6 Rest of Europe
- 9.4 Asia Pacific
- 9.4.1 China
- 9.4.2 India
- 9.4.3 Japan
- 9.4.4 Australia
- 9.4.5 South Korea
- 9.4.6 Rest of Asia Pacific
- 9.5 Latin America
- 9.5.1 Brazil
- 9.5.2 Mexico
- 9.5.3 Rest of Latin America
- 9.6 Middle East and Africa
- 9.6.1 Saudi Arabia
- 9.6.2 South Africa
- 9.6.3 UAE
- 9.6.4 Rest of Middle East and Africa
Chapter 10 Company Profiles
- 10.1 Dole Food Company
- 10.2 Conagra Brands, Inc.
- 10.3 Del Monte Foods, Inc.
- 10.4 Nestle S.A.
- 10.5 The Kraft Heinz Company
- 10.6 General Mills, Inc.
- 10.7 B&G Foods, Inc.
- 10.8 ADM
- 10.9 ABC Fruits
- 10.10 Conagra
- 10.11 Vebzy Nature
- 10.12 Grofresh Agrofoods Pvt Ltd
