|
시장보고서
상품코드
1892840
화물 트럭 운송 시장 기회, 성장요인, 업계 동향 분석 및 예측(2026-2035년)Freight Trucking Market Opportunity, Growth Drivers, Industry Trend Analysis, and Forecast 2026 - 2035 |
||||||
세계의 화물 트럭 운송 시장은 2025년에 2조 6,700억 달러로 평가되었고, 2035년까지 연평균 복합 성장률(CAGR) 4.1%로 성장하여 3조 9,800억 달러에 이를 것으로 예측됩니다.

도로망은 여전히 세계 물류의 근간이며, 트럭 운송은 전 세계 화물 운송량의 60% 이상을 차지하고 있습니다. 의약품, 식음료, 화학 등의 산업은 제품의 품질, 신선도, 안전성을 유지하기 위해 트럭 운송에 크게 의존하고 있습니다. 신뢰성과 효율성을 겸비한 운송 수단을 원하는 기업에게 트럭을 통한 국내 및 국제 화물 운송 서비스의 확대는 최적의 솔루션이 되고 있습니다. 매년 증가하는 물류 스타트업의 수는 국내 및 국경 간 화물 솔루션을 제공하고 조기에 시장 점유율을 확보하려는 투자자들의 자신감을 보여줍니다. 전용 차선 설치, LNG 및 전기 트럭에 대한 우대 조치 등 여러 지역 정부의 이니셔티브는 효율성을 높이고 지속 가능한 트럭 운송의 실천을 촉진하며 업계의 미래를 형성하고 있습니다.
| 시장 범위 | |
|---|---|
| 개시 연도 | 2025년 |
| 예측 연도 | 2026-2035년 |
| 개시 연도 시장 규모 | 2조 6,700억 달러 |
| 예측 금액 | 3조 9,800억 달러 |
| CAGR | 4.1% |
트럭 트레일러 부문은 2025년 33.2%의 점유율을 차지했습니다. 트럭트레일러는 주로 비신선한 물품의 운송에 이용되며, 소매업, 소비재, 전자상거래 분야에서 필수적인 존재입니다. 전 세계적으로 1,000만 대 이상의 트럭 트레일러가 등록되어 산업 및 상업용 화물 운송에 중요한 역할을 하고 있습니다.
소매 및 전자상거래 부문은 2026년부터 2035년까지 연평균 복합 성장률(CAGR) 5.9%를 보일 것으로 예측됩니다. 온라인 쇼핑 증가, 라스트마일 배송 네트워크의 확대, 당일 또는 익일 배송에 대한 소비자의 기대치가 높아지면서 수요가 증가하고 있습니다. 옴니채널 소매의 흐름, 소량화물의 빈번한 운송, 신속한 물류 솔루션의 필요성으로 인해 트럭 운송은 시장 확대의 주요 원동력으로 부상하고 있습니다.
미국 화물 트럭 운송 시장은 2025년 8,303억 달러로 평가되었습니다. 시장의 성장은 탄탄한 국내 제조업, 소비자 주도의 높은 물동량, 광범위한 주 간 네트워크에 의해 뒷받침되고 있습니다. 트럭은 여전히 화물 운송의 주요 수단으로 도로 운송을 선호하는 물류 패턴의 변화와 경제적 요인을 반영하고 있습니다.
자주 묻는 질문
목차
제1장 조사 방법
- 시장 범위와 정의
- 조사 설계
- 조사 접근
- 데이터 수집 방법
- 데이터 마이닝 소스
- 세계
- 지역별/국가별
- 기본 추정치와 계산
- 기준연도 계산
- 시장 추정 주요 동향
- 1차 조사와 검증
- 1차 정보
- 예측
- 조사의 전제조건과 제한 사항
제2장 주요 요약
제3장 업계 인사이트
- 생태계 분석
- 공급업체 상황
- 이익률
- 비용 구조
- 각 단계별 부가가치
- 밸류체인에 영향을 미치는 요인
- 파괴적 변화
- 업계에 대한 영향요인
- 성장 촉진요인
- 업계의 잠재적 리스크&과제
- 시장 기회
- 성장 가능성 분석
- 규제 상황
- 북미
- 미국 기업의 평균 연비 기준(CAFE)
- 캐나다의 대형 차량 온실가스 배출 규제
- 유럽
- 독일의 연방 도로 화물 운송법(GuKG)
- 프랑스의 도로 화물 운송용 모빌리티 기본법(LOM)
- 영국의 대형 트럭(HGV) 도로 이용자 과징금에 관한 규제
- 스페인 도로 운송 규제(ROTT)
- 아시아태평양
- 대형 트럭용 중국 VI 배출 가스 규제
- 일본의 자동차 배출 가스 규제
- 인도의 상용차용 바 라토 단계 배출 가스 기준
- 라틴아메리카
- 브라질의 대형 트럭용 PROCONVE P8배출 가스 기준
- 아르헨티나의 국가 도로 화물 운송 규제
- 멕시코의 NOM-044 대형 디젤차배출 가스 기준
- 중동 및 아프리카
- 아랍에미리트의 연방 운송 국 상업 운송 규제
- 화물 차량에 관한 남아프리카공화국 도로 교통법(NRTA)
- 사우디아라비아의 SASO 연비 및 배출 가스 기준
- 북미
- Porter's Five Forces 분석
- PESTEL 분석
- 기술과 혁신 동향
- 현재 기술 동향
- 신기술
- 가격 동향
- 지역별
- 제품별
- 비용 내역 분석
- 지속가능성과 환경에 대한 영향
- 환경 영향 평가
- 사회적 영향과 지역사회에의 기여
- 거버넌스와 기업 사회적 책임
- 지속가능한 금융과 투자 동향
- 국경을 넘은 무역과 국제 화물 운송
- 주요 국경간 무역 회랑의 성장
- 세관 절차와 국경에서의 지연
- 양자 간 협정
- 국제 트럭 운송 허가증 및 통과 제한
- 도로 인프라 및 화물 회랑 평가
- 국도 및 고속도로 상황
- 전용 화물 회랑 및 물류 회랑 확충
- 트럭 주차장, 휴식 시설 및 운전자용 안전 인프라
- 요금 징수 시스템, 도로 이용자 부담금 및 운송 사업자에 대한 비용 영향
- 인프라 투자 및 민관 제휴
- 향후 전망과 기회
제4장 경쟁 구도
- 서론
- 기업의 시장 점유율 분석
- 북미
- 유럽
- 아시아태평양
- 라틴아메리카
- 중동 및 아프리카
- 주요 시장 기업의 경쟁 분석
- 경쟁 포지셔닝 매트릭스
- 전략적 전망 매트릭스
- 주요 발전
- 인수합병(M&A)
- 제휴 및 협업
- 신제품 발매
- 사업 확대 계획과 자금조달
제5장 시장 추산 및 예측 : 트럭별, 2022-2035
- 주요 동향
- 트럭 탱크
- 트럭 트레일러
- 냉장 트럭
- 플랫베드 트럭
- 기타
제6장 시장 추산 및 예측 : 거리별, 2022-2035
- 주요 동향
- 지역별
- 장거리 운송
제7장 시장 추산 및 예측 : 서비스 모델별, 2022-2035
- 주요 동향
- Full Truckload (FTL)
- Less Than Truckload (LTL)
제8장 시장 추산 및 예측 : 트럭 사이즈별, 2022-2035
- 주요 동향
- 소형 트럭(LDT)
- 중형 트럭(MDT)
- 대형 트럭(HDT)
제9장 시장 추산 및 예측 : 기업 규모별, 2022-2035
- 주요 동향
- 중소기업
- 대기업
제10장 시장 추산 및 예측 : 화물별, 2022-2035
- 주요 동향
- 건물
- 신선식품
- 위험물
- 기타
제11장 시장 추산 및 예측 : 산업별, 2022-2035
- 주요 동향
- 식품 및 음료
- 소매업 및 전자상거래
- 산업 및 제조업
- 에너지 및 광업
- 석유 및 가스
- 의약품 및 의료 분야
- 화학
- 기타
제12장 시장 추산 및 예측 : 지역별, 2022-2035
- 주요 동향
- 북미
- 미국
- 캐나다
- 유럽
- 독일
- 영국
- 프랑스
- 이탈리아
- 스페인
- 러시아
- 북유럽 국가
- 베네룩스
- 아시아태평양
- 중국
- 인도
- 일본
- 한국
- ANZ
- 싱가포르
- 말레이시아
- 인도네시아
- 베트남
- 태국
- 라틴아메리카
- 브라질
- 멕시코
- 아르헨티나
- 콜롬비아
- 중동 및 아프리카(MEA)
- 남아프리카공화국
- 사우디아라비아
- 아랍에미리트(UAE)
제13장 기업 개요
- Global companies
- United Parcel Service
- FedEx
- DHL
- A.P. Moller-Maersk
- XPO Logistics
- DB Schenker
- Kuehne+Nagel
- Nippon Express
- Ryder System
- C.H. Robinson
- Regional companies
- J.B. Hunt Transport
- Schneider National
- Knight-Swift Transportation
- Old Dominion Freight Line
- Werner Enterprises
- Yamato Transport
- DSV Road
- GEFCO
- Sagawa Express
- CJ Logistics
- Emerging companies
- Convoy
- Full Truck Alliance
- CargoX
- BlackBuck
- Sennder
The Global Freight Trucking Market was valued at USD 2.67 trillion in 2025 and is estimated to grow at a CAGR of 4.1% to reach USD 3.98 trillion by 2035.
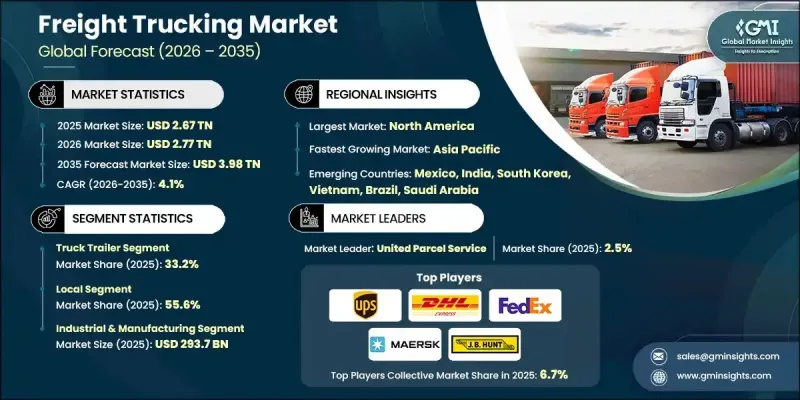
Roadways remain the backbone of global logistics, with trucks accounting for more than 60% of worldwide freight movement. Industries such as pharmaceuticals, food and beverages, and chemicals rely heavily on trucking to preserve product quality, freshness, and safety. Expanding domestic and international freight services through trucks has become a preferred solution for businesses seeking reliable and efficient transportation. The rising number of logistics startups each year highlights investor confidence in capturing market share early, providing both domestic and cross-border freight solutions. Government initiatives in multiple regions, including the construction of dedicated lanes and incentives for LNG or electric trucks, are boosting efficiency and promoting the adoption of sustainable trucking practices, shaping the future of the industry.
| Market Scope | |
|---|---|
| Start Year | 2025 |
| Forecast Year | 2026-2035 |
| Start Value | $2.67 Trillion |
| Forecast Value | $3.98 Trillion |
| CAGR | 4.1% |
The truck trailer segment held a 33.2% share in 2025. Truck trailers are primarily utilized for transporting non-perishable goods, making them essential in retail, consumer goods, and e-commerce sectors. Globally, over ten million truck trailers are registered, underscoring their critical role in industrial and commercial freight operations.
The retail and e-commerce segment is projected to grow at a CAGR of 5.9% between 2026 and 2035. Increasing online shopping, expanding last-mile delivery networks, and growing consumer expectations for same-day or next-day delivery are driving demand. The omnichannel retail trend, frequent small-parcel shipments, and the need for rapid logistics solutions are pushing trucking to the forefront as a key driver of market expansion.
U.S. Freight Trucking Market was valued at USD 830.3 billion in 2025. The market growth is supported by strong domestic manufacturing, high consumer-driven freight volumes, and an extensive interstate network. Trucks remain the primary mode for transporting goods, reflecting changing logistics patterns and economic factors that favor road transportation.
Major players in the Global Freight Trucking Market include DHL Express, United Parcel Service, J.B. Hunt Transport, FedEx, A.P. Moller - Maersk, Nippon Express, Schneider National, XPO Logistics, C.H. Robinson, and Kuehne + Nagel. Companies in the Freight Trucking Market are strengthening their market position through several strategic approaches. They are investing in fleet modernization, adopting electric and LNG trucks to meet sustainability targets, and expanding regional and international networks. Firms are also leveraging technology such as route optimization software, real-time tracking, and data analytics to improve operational efficiency. Strategic partnerships and acquisitions enhance market penetration and service coverage. Additionally, companies focus on specialized freight solutions for sectors like pharmaceuticals, retail, and e-commerce, while developing robust last-mile delivery capabilities to meet rising consumer expectations and maintain competitive advantage.
Table of Contents
Chapter 1 Methodology
- 1.1 Market scope and definition
- 1.2 Research design
- 1.2.1 Research approach
- 1.2.2 Data collection methods
- 1.3 Data mining sources
- 1.3.1 Global
- 1.3.2 Regional/Country
- 1.4 Base estimates and calculations
- 1.4.1 Base year calculation
- 1.4.2 Key trends for market estimation
- 1.5 Primary research and validation
- 1.5.1 Primary sources
- 1.6 Forecast
- 1.7 Research assumptions and limitations
Chapter 2 Executive Summary
- 2.1 Industry 360° synopsis
- 2.2 Key market trends
- 2.2.1 Regional
- 2.2.2 Truck
- 2.2.3 Distance
- 2.2.4 Service Model
- 2.2.5 Truck Size
- 2.2.6 Cargo
- 2.2.7 Enterprise Size
- 2.2.8 Industry
- 2.3 TAM analysis, 2026-2035
- 2.4 CXO perspectives: Strategic imperatives
- 2.4.1 Executive decision points
- 2.4.2 Critical success factors
- 2.5 Future outlook and recommendations
Chapter 3 Industry Insights
- 3.1 Industry ecosystem analysis
- 3.1.1 Supplier landscape
- 3.1.2 Profit margin
- 3.1.3 Cost structure
- 3.1.4 Value addition at each stage
- 3.1.5 Factor affecting the value chain
- 3.1.6 Disruptions
- 3.2 Industry impact forces
- 3.2.1 Growth drivers
- 3.2.1.1 Global e-commerce and omnichannel retail growth
- 3.2.1.2 Global trade deals and partnership expansion
- 3.2.1.3 Infrastructure investment
- 3.2.1.4 Fleet renewal and stricter emissions standards
- 3.2.2 Industry pitfalls and challenges
- 3.2.2.1 Regulatory fragmentation across countries/regions
- 3.2.2.2 Road congestion and deteriorating urban access
- 3.2.3 Market opportunities
- 3.2.3.1 Electrification & zero-emission truck adoption
- 3.2.3.2 Automated Driving Systems in Freight Trucks
- 3.2.3.3 Rapid expansion of digital freight platforms
- 3.2.3.4 Value-added logistics
- 3.2.1 Growth drivers
- 3.3 Growth potential analysis
- 3.4 Regulatory landscape
- 3.4.1 North America
- 3.4.1.1 U.S. corporate average fuel economy (CAFE) standards
- 3.4.1.2 Canadian heavy-duty vehicle greenhouse gas emissions regulations
- 3.4.2 Europe
- 3.4.2.1 German federal road freight transport act (GuKG)
- 3.4.2.2 French mobility orientation law (LOM) for road freight
- 3.4.2.3 UK heavy goods vehicle (HGV) road user levy regulations
- 3.4.2.4 Spanish road transport regulation (ROTT)
- 3.4.3 Asia Pacific
- 3.4.3.1 China VI emission standards for heavy-duty trucks
- 3.4.3.2 Japan motor vehicle exhaust emissions standards
- 3.4.3.3 Bharat stage emission standards for commercial vehicles in India
- 3.4.4 Latin America
- 3.4.4.1 Brazil PROCONVE P8 emission standards for heavy trucks
- 3.4.4.2 Argentine national road freight transport regulations
- 3.4.4.3 Mexican NOM-044 heavy-duty diesel emission standards
- 3.4.5 Middle East & Africa
- 3.4.5.1 UAE federal transport authority commercial transport regulations
- 3.4.5.2 South African national road traffic act (NRTA) for freight vehicles
- 3.4.5.3 Saudi Arabian SASO fuel economy & emission standards
- 3.4.1 North America
- 3.5 Porter's analysis
- 3.6 PESTEL analysis
- 3.7 Technology and innovation landscape
- 3.7.1 Current technological trends
- 3.7.2 Emerging technologies
- 3.8 Price trends
- 3.8.1 By region
- 3.8.2 By product
- 3.9 Cost breakdown analysis
- 3.10 Sustainability and environmental impact
- 3.10.1 Environmental impact assessment
- 3.10.2 Social Impact & community benefits
- 3.10.3 Governance & corporate responsibility
- 3.10.4 Sustainable finance & investment trends
- 3.11 Cross-Border Trade & International Freight Movements
- 3.11.1 Growth of major cross-border trade corridors
- 3.11.2 Customs procedures & border delays
- 3.11.3 Bilateral agreements
- 3.11.4 International trucking permits & transit restrictions
- 3.12 Road infrastructure & freight corridor assessment
- 3.12.1 Condition of national highways and expressways
- 3.12.2 Expansion of dedicated freight corridors and logistics corridors
- 3.12.3 Truck parking, rest areas & safety infrastructure for drivers
- 3.12.4 Tolling systems, road user charges & cost implications for carriers
- 3.12.5 Infrastructure investments, public-private partnerships
- 3.13 Future outlook & opportunities
Chapter 4 Competitive Landscape, 2025
- 4.1 Introduction
- 4.2 Company market share analysis
- 4.2.1 North America
- 4.2.2 Europe
- 4.2.3 Asia Pacific
- 4.2.4 LATAM
- 4.2.5 MEA
- 4.3 Competitive analysis of major market players
- 4.4 Competitive positioning matrix
- 4.5 Strategic outlook matrix
- 4.6 Key developments
- 4.6.1 Mergers & acquisitions
- 4.6.2 Partnerships & collaborations
- 4.6.3 New product launches
- 4.6.4 Expansion plans and funding
Chapter 5 Market Estimates & Forecast, By Truck, 2022 - 2035 ($Bn, fleet size)
- 5.1 Key trends
- 5.2 Lorry tank
- 5.3 Truck trailer
- 5.4 Refrigerated truck
- 5.5 Flatbed truck
- 5.6 Others
Chapter 6 Market Estimates & Forecast, By Distance, 2022 - 2035 ($Bn, fleet size)
- 6.1 Key trends
- 6.2 Local
- 6.3 Long haul
Chapter 7 Market Estimates & Forecast, By Service Model, 2022 - 2035 ($Bn, fleet size)
- 7.1 Key trends
- 7.2 Full Truckload (FTL)
- 7.3 Less Than Truckload (LTL)
Chapter 8 Market Estimates & Forecast, By Truck Size, 2022 - 2035 ($Bn, fleet size)
- 8.1 Key trends
- 8.2 Light-duty trucks (LDTs)
- 8.3 Medium-duty trucks (MDTs)
- 8.4 Heavy-duty trucks (HDTs)
Chapter 9 Market Estimates & Forecast, By Enterprise Size, 2022 - 2035 ($Bn, fleet size)
- 9.1 Key trends
- 9.2 SMEs
- 9.3 Large Enterprises
Chapter 10 Market Estimates & Forecast, By Cargo, 2022 - 2035 ($Bn, fleet size)
- 10.1 Key trends
- 10.2 Dry Goods
- 10.3 Perishables
- 10.4 Hazardous materials
- 10.5 Others
Chapter 11 Market Estimates & Forecast, By Industry, 2022 - 2035 ($Bn, fleet size)
- 11.1 Key trends
- 11.2 Food & beverages
- 11.3 Retail & e-commerce
- 11.4 Industrial & manufacturing
- 11.5 Energy and mining
- 11.6 Oil & gas
- 11.7 Pharmaceutical & healthcare
- 11.8 Chemical
- 11.9 Others
Chapter 12 Market Estimates & Forecast, By Region, 2022 - 2035 ($Bn, fleet size)
- 12.1 Key trends
- 12.2 North America
- 12.2.1 US
- 12.2.2 Canada
- 12.3 Europe
- 12.3.1 Germany
- 12.3.2 UK
- 12.3.3 France
- 12.3.4 Italy
- 12.3.5 Spain
- 12.3.6 Russia
- 12.3.7 Nordics
- 12.3.8 Benelux
- 12.4 Asia Pacific
- 12.4.1 China
- 12.4.2 India
- 12.4.3 Japan
- 12.4.4 South Korea
- 12.4.5 ANZ
- 12.4.6 Singapore
- 12.4.7 Malaysia
- 12.4.8 Indonesia
- 12.4.9 Vietnam
- 12.4.10 Thailand
- 12.5 Latin America
- 12.5.1 Brazil
- 12.5.2 Mexico
- 12.5.3 Argentina
- 12.5.4 Colombia
- 12.6 MEA
- 12.6.1 South Africa
- 12.6.2 Saudi Arabia
- 12.6.3 UAE
Chapter 13 Company Profiles
- 13.1 Global companies
- 13.1.1 United Parcel Service
- 13.1.2 FedEx
- 13.1.3 DHL
- 13.1.4 A.P. Moller - Maersk
- 13.1.5 XPO Logistics
- 13.1.6 DB Schenker
- 13.1.7 Kuehne + Nagel
- 13.1.8 Nippon Express
- 13.1.9 Ryder System
- 13.1.10 C.H. Robinson
- 13.2 Regional companies
- 13.2.1 J.B. Hunt Transport
- 13.2.2 Schneider National
- 13.2.3 Knight-Swift Transportation
- 13.2.4 Old Dominion Freight Line
- 13.2.5 Werner Enterprises
- 13.2.6 Yamato Transport
- 13.2.7 DSV Road
- 13.2.8 GEFCO
- 13.2.9 Sagawa Express
- 13.2.10 CJ Logistics
- 13.3 Emerging companies
- 13.3.1 Convoy
- 13.3.2 Full Truck Alliance
- 13.3.3 CargoX
- 13.3.4 BlackBuck
- 13.3.5 Sennder