|
시장보고서
상품코드
1928976
간섭 합성 개구 레이더 시장 기회, 성장 촉진요인, 업계 동향 분석 및 예측(2026-2035년)Interferometric Synthetic Aperture Radar (InSAR) Market Opportunity, Growth Drivers, Industry Trend Analysis, and Forecast 2026 - 2035 |
||||||
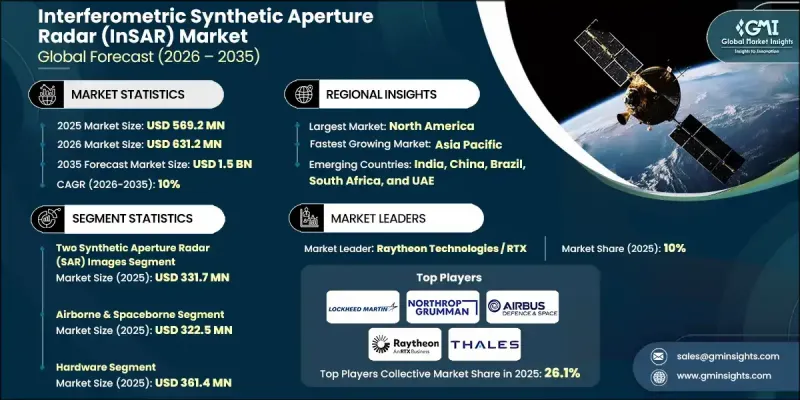
세계의 간섭 합성 개구 레이더(InSAR) 시장은 2025년에 5억 6,920만 달러로 평가되었으며, 2035년까지 CAGR 10%로 성장하여 15억 달러에 달할 것으로 예측됩니다.

이러한 성장 궤적은 고정밀 지표면 모니터링에 대한 수요 증가, 레이더 데이터와 인공지능, 머신러닝, 클라우드 기반 분석의 결합, 에너지, 천연자원, 공공 부문 우주 계획에서의 활용 확대에 힘입어 성장세를 보이고 있습니다. 잦은 재방문 기능을 갖춘 위성 별자리 도입이 증가함에 따라 데이터 가용성이 향상되고 모니터링 정확도가 지속적으로 개선되고 있습니다. 날씨와 조명 조건에 관계없이 일관된 광역 측정이 가능한 이 기술의 능력은 장기 계획, 위험 감소 및 자산 관리에서 그 중요성이 커지고 있습니다. 분석 플랫폼이 성숙해짐에 따라 조직은 예측 모델링과 운영 의사결정을 지원하기 위해 간섭 레이더의 인사이트에 대한 의존도를 높이고 있습니다. 정부 지원 관측 프로그램과 상업적 채택이 시장의 확장성을 강화하는 한편, 처리 기술 및 플랫폼 통합의 지속적인 혁신이 산업 전반의 접근성을 확대하고 있습니다. 이러한 복합적인 요인으로 인해 간섭 합성 개구 레이더는 인프라 복원력, 환경 모니터링, 세계 전략 계획을 지원하는 중요한 지형공간 정보 도구로 자리매김하고 있습니다.
| 시장 범위 | |
|---|---|
| 시작 연도 | 2025년 |
| 예측 연도 | 2026-2035 |
| 개시시 가치 | 5억 6,920만 달러 |
| 예측 금액 | 15억 달러 |
| CAGR | 10% |
지속적인 유지보수 및 모니터링 애플리케이션은 시간이 지남에 따라 미세한 표면 변화를 감지할 수 있는 간섭 레이더의 능력으로 인해 채택이 가속화되고 있습니다. 지속적인 관찰은 예방적 유지보수 계획 수립을 지원하고, 구조적 고장의 가능성을 줄이고, 장기적인 수리 비용을 절감하며, 재난 대응 전략을 강화합니다. 에너지 및 자원 분야에서 이 기술은 운영 지역 주변의 지반 변동을 정밀하게 측정하고, 안전 목표 달성을 지원하고, 환경 영향을 최소화하며, 규제 준수를 개선하는 등 점점 더 중요한 역할을 하고 있습니다. 대규모 모니터링은 수동 검사에 대한 의존도를 낮추면서 예측 유지보수 및 운영 위험 평가를 강화합니다.
2025년 기준, 2장 영상 합성 개구부 레이더 분야는 3억 3,170만 달러에 달합니다. 이 방법은 낮은 도입 비용, 처리의 간편성, 변형 및 안정성 평가의 신뢰성 높은 정확도로 인해 널리 채택되고 있습니다. 많은 사용자들은 해상도 품질과 효율적인 워크플로우의 균형을 맞추기 위해 더 복잡한 다중 이미지 기술이 필요하지 않습니다.
항공기 탑재 및 우주 탑재 플랫폼은 주요 도입 카테고리를 형성하여 2025년 3억 2,250만 달러의 시장 규모를 창출할 것으로 예상됩니다. 이러한 플랫폼은 광범위한 지리적 커버리지와 일관된 관측 주기를 제공하며, 빈번한 데이터 업데이트와 광범위한 가시성을 필요로 하는 대규모 모니터링 및 국가 관측 이니셔티브에 필수적입니다.
북미 간섭 합성 개구 레이더(InSAR) 시장은 2025년 33.5%의 점유율을 차지했으며, 첨단 분석 기술, 우주 기술, 감시 솔루션에 대한 지속적인 투자를 통해 선도적 지위를 유지할 것으로 보입니다. 공공 및 상업 부문의 강력한 도입으로 고해상도 레이더 데이터세트 및 분석 서비스에 대한 수요가 증가하여 지역 시장의 강점을 더욱 강화하고 있습니다.
자주 묻는 질문
목차
제1장 조사 방법과 범위
제2장 주요 요약
제3장 업계 인사이트
- 생태계 분석
- 공급업체 상황
- 이익률
- 비용 구조
- 각 단계의 부가가치
- 밸류체인에 영향을 미치는 요인
- 디스럽션
- 업계에 대한 영향요인
- 성장 촉진요인
- 인프라 모니터링·보수
- AI, 머신러닝, 클라우드 분석과의 통합
- 석유 및 가스·광업 분야의 응용 사례
- 방위·정부 우주 프로그램
- 위성 컨스텔레이션 및 고빈도 재방
- 과제와 어려움
- 도입 비용 및 시스템 비용 높음
- 기술적 복잡성과 스킬 요건
- 기회 :
- 인프라 내결함성 및 스마트 시티 프로젝트
- 환경 모니터링과 재해 관리
- 성장 촉진요인
- 성장 가능성 분석
- 규제 상황
- 북미
- 유럽
- 아시아태평양
- 라틴아메리카
- 중동 및 아프리카
- Porters 분석
- PESTEL 분석
- 기술과 혁신 동향
- 현재 기술 동향
- 신기술
- 신흥 비즈니스 모델
- 컴플라이언스 요건
- 지속가능성에 대한 대처
- 공급망 회복탄력성
- 지정학적 분석
- 디지털 전환
- 인수합병 및 전략적 제휴 동향
제4장 경쟁 구도
- 소개
- 기업의 시장 점유율 분석
- 지역별
- 북미
- 유럽
- 아시아태평양
- 라틴아메리카
- 중동 및 아프리카
- 시장 집중도 분석
- 지역별
- 주요 기업의 경쟁 벤치마킹
- 제품 포트폴리오 비교
- 제품 라인 폭
- 기술
- 혁신
- 지역별 사업 추진 비교
- 세계인 사업 추진 분석
- 서비스 네트워크 커버율
- 지역별 시장 침투율
- 경쟁 포지셔닝 매트릭스
- 리더 기업
- 과제자
- 팔로어
- 틈새 플레이어
- 전략적 전망 매트릭스
- 제품 포트폴리오 비교
- 주요 발전, 2022-2025
- 인수합병
- 제휴 및 합작투자
- 기술적 진보
- 확대 및 투자전략
- 지속가능성에 대한 대처
- 디지털 전환의 대처
- 신흥/스타트업 경쟁 동향
제5장 시장 추정 및 예측 : 유형별, 2022-2035
- 2매 합성 개구 레이더(SAR) 영상
- 복수 합성 개구 레이더(SAR) 영상
제6장 시장 추정 및 예측 : 플랫폼별, 2022-2035
- 항공기 탑재형 및 우주 탑재형
- 지상형
- 기타
제7장 시장 추정 및 예측 : 구성요소별, 2022-2035
- 하드웨어
- 소프트웨어
- 서비스
제8장 시장 추정 및 예측 : 용도별, 2022-2035
- 항행
- 영향 평가
- 홍수와 가뭄
- 지진 위험물
- 노천 채굴 광산
- 기타
- 모니터링
- 지반 침하·지반 변동
- 인프라 안정성
- 빙하 및 빙상
- 화산 활동
- 기타
- 매핑 및 계획
- 기타
제9장 시장 추정 및 예측 : 최종 용도별, 2022-2035
- 항공우주 및 방위
- 농업
- 토목·건설
- 환경 모니터링
- 광업
- 석유 및 가스
- 기타
제10장 시장 추정 및 예측 : 지역별, 2022-2035
- 북미
- 미국
- 캐나다
- 유럽
- 독일
- 영국
- 프랑스
- 스페인
- 이탈리아
- 네덜란드
- 아시아태평양
- 중국
- 인도
- 일본
- 호주
- 한국
- 라틴아메리카
- 브라질
- 멕시코
- 아르헨티나
- 중동 및 아프리카
- 사우디아라비아
- 남아프리카공화국
- 아랍에미리트
제11장 기업 개요
- 세계의 주요 기업
- Airbus Defence and Space
- Lockheed Martin Corporation
- Northrop Grumman Corporation
- Raytheon Technologies
- Thales Group
- BAE Systems
- Leonardo S.p.A.
- L3 Harris Technologies
- 지역별 주요 기업
- 북미
- Capella Space
- MDA Ltd.
- Orbital Insight
- SkyGeo
- 유럽
- GAMMA Remote Sensing AG
- CGG
- Tre Altamira
- Tele-Rilevamento Europa
- sarmap SA
- 아시아태평양
- ICEYE
- Synspective
- 북미
- 틈새/디스럽터 기업
- 3vGeomatics
- GroundProbe
- PCI Geomatics
The Global Interferometric Synthetic Aperture Radar (InSAR) Market was valued at USD 569.2 million in 2025 and is estimated to grow at a CAGR of 10% to reach USD 1.5 billion by 2035.
The growth trajectory is driven by rising demand for high-precision surface monitoring, the convergence of radar data with artificial intelligence, machine learning, and cloud-based analytics, and expanding use across energy, natural resource, and public-sector space initiatives. The increasing deployment of satellite constellations with frequent revisit capabilities continues to enhance data availability and improve monitoring accuracy. Technology's ability to deliver consistent, large-area measurements regardless of weather or lighting conditions has elevated its importance for long-term planning, risk mitigation, and asset management. As analytical platforms mature, organizations increasingly rely on interferometric radar insights to support predictive modeling and operational decision-making. Government-backed observation programs and commercial adoption are reinforcing market scalability, while continuous innovation in processing techniques and platform integration is expanding accessibility across industries. These combined factors position interferometric synthetic aperture radar as a critical geospatial intelligence tool supporting infrastructure resilience, environmental oversight, and strategic planning worldwide.
| Market Scope | |
|---|---|
| Start Year | 2025 |
| Forecast Year | 2026-2035 |
| Start Value | $569.2 Million |
| Forecast Value | $1.5 Billion |
| CAGR | 10% |
Ongoing maintenance and monitoring applications are accelerating adoption due to the capability of interferometric radar to detect minute surface changes over time. Continuous observation supports proactive maintenance planning, lowers the probability of structural failures, reduces long-term repair costs, and strengthens disaster readiness strategies. In the energy and resource sectors, technology plays a growing role by enabling precise measurement of land movement around operational zones, supporting safety objectives, minimizing environmental exposure, and improving regulatory compliance. Large-scale monitoring reduces dependence on manual inspections while enhancing predictive maintenance and operational risk assessment.
The two-image synthetic aperture radar segment reached USD 331.7 million in 2025. This method remains widely adopted due to its lower implementation costs, reduced processing complexity, and reliable accuracy for deformation and stability assessments. For many users, the balance between resolution quality and streamlined workflows eliminates the need for more complex multi-image techniques.
The airborne and spaceborne platforms formed the leading deployment category, generating USD 322.5 million in 2025. These platforms support extensive geographic coverage and consistent observation cycles, making them essential for large-scale monitoring and national observation initiatives that require frequent data updates and broad visibility.
North America Interferometric Synthetic Aperture Radar (InSAR) Market accounted for 33.5% share in 2025, maintaining leadership through sustained investment in advanced analytics, space technologies, and monitoring solutions. Strong adoption across public agencies and commercial sectors has increased demand for high-resolution radar datasets and analytical services, reinforcing regional market strength.
Key companies active in the Global Interferometric Synthetic Aperture Radar (InSAR) Market include Airbus Defence and Space, ICEYE, Capella Space, Lockheed Martin Corporation, Northrop Grumman Corporation, Leonardo S.p.A., Thales Group, Raytheon Technologies, L3Harris Technologies, BAE Systems, MDA Ltd., Synspective, GAMMA Remote Sensing AG, CGG, GroundProbe, Orbital Insight, PCI Geomatics, SkyGeo, sarmap SA, Tre Altamira, Tele-Rilevamento Europa, and 3vGeomatics. Companies in the Global Interferometric Synthetic Aperture Radar (InSAR) Market strengthen their competitive position through continuous technology innovation, expansion of satellite and airborne capabilities, and integration of advanced analytics. Strategic investments in AI-driven data processing and cloud-based delivery platforms improve scalability and customer accessibility. Partnerships with government agencies, infrastructure operators, and energy companies help secure long-term contracts and recurring revenue streams.
Table of Contents
Chapter 1 Methodology and Scope
- 1.1 Market scope and definition
- 1.2 Research design
- 1.2.1 Research approach
- 1.2.2 Data collection methods
- 1.3 Data mining sources
- 1.3.1 Global
- 1.3.2 Regional/Country
- 1.4 Base estimates and calculations
- 1.4.1 Base year calculation
- 1.4.2 Key trends for market estimation
- 1.5 Primary research and validation
- 1.5.1 Primary sources
- 1.6 Forecast model
- 1.7 Research assumptions and limitations
Chapter 2 Executive Summary
- 2.1 Industry 360° synopsis
- 2.2 Key market trends
- 2.2.1 Type trends
- 2.2.2 Platform trends
- 2.2.3 Component trends
- 2.2.4 Application trends
- 2.2.5 End use trends
- 2.2.6 Regional trends
- 2.3 TAM Analysis, 2026-2035 (USD Million)
- 2.4 CXO perspectives: Strategic imperatives
- 2.4.1 Executive decision points
- 2.4.2 Critical success factors
- 2.5 Future outlook and strategic recommendations
Chapter 3 Industry Insights
- 3.1 Industry ecosystem analysis
- 3.1.1 Supplier landscape
- 3.1.2 Profit margin
- 3.1.3 Cost structure
- 3.1.4 Value addition at each stage
- 3.1.5 Factor affecting the value chain
- 3.1.6 Disruptions
- 3.2 Industry impact forces
- 3.2.1 Growth drivers
- 3.2.1.1 Infrastructure monitoring & maintenance
- 3.2.1.2 Integration with AI, ML, and cloud analytics
- 3.2.1.3 Oil, gas & mining applications
- 3.2.1.4 Defense & government space programs
- 3.2.1.5 Satellite constellations & high-frequency revisit
- 3.2.2 Pitfalls and challenges
- 3.2.2.1 High deployment & system costs
- 3.2.2.2 Technical complexity & skill requirements
- 3.2.3 Opportunities:
- 3.2.3.1 Infrastructure Resilience & Smart City Projects
- 3.2.3.2 Environmental Monitoring & Disaster Management
- 3.2.1 Growth drivers
- 3.3 Growth potential analysis
- 3.4 Regulatory landscape
- 3.4.1 North America
- 3.4.2 Europe
- 3.4.3 Asia Pacific
- 3.4.4 Latin America
- 3.4.5 Middle East & Africa
- 3.5 Porter';s analysis
- 3.6 PESTEL analysis
- 3.7 Technology and Innovation landscape
- 3.7.1 Current technological trends
- 3.7.2 Emerging technologies
- 3.8 Emerging Business Models
- 3.9 Compliance Requirements
- 3.10 Sustainability Initiatives
- 3.11 Supply Chain Resilience
- 3.12 Geopolitical Analysis
- 3.13 Digital Transformation
- 3.14 Mergers, Acquisitions, and Strategic Partnerships Landscape
Chapter 4 Competitive Landscape, 2025
- 4.1 Introduction
- 4.2 Company market share analysis
- 4.2.1 By region
- 4.2.1.1 North America
- 4.2.1.2 Europe
- 4.2.1.3 Asia Pacific
- 4.2.1.4 Latin America
- 4.2.1.5 Middle East & Africa
- 4.2.2 Market concentration analysis
- 4.2.1 By region
- 4.3 Competitive benchmarking of key players
- 4.3.1 Product portfolio comparison
- 4.3.1.1 Product range breadth
- 4.3.1.2 Technology
- 4.3.1.3 Innovation
- 4.3.2 Geographic presence comparison
- 4.3.2.1 Global footprint analysis
- 4.3.2.2 Service network coverage
- 4.3.2.3 Market penetration by region
- 4.3.3 Competitive positioning matrix
- 4.3.3.1 Leaders
- 4.3.3.2 Challengers
- 4.3.3.3 Followers
- 4.3.3.4 Niche players
- 4.3.4 Strategic outlook matrix
- 4.3.1 Product portfolio comparison
- 4.4 Key developments, 2022-2025
- 4.4.1 Mergers and acquisitions
- 4.4.2 Partnerships and collaborations
- 4.4.3 Technological advancements
- 4.4.4 Expansion and investment strategies
- 4.4.5 Sustainability initiatives
- 4.4.6 Digital transformation initiatives
- 4.5 Emerging/ startup competitors landscape
Chapter 5 Market Estimates and Forecast, By Type, 2022 - 2035 (USD Million)
- 5.1 Key trends
- 5.2 Two Synthetic Aperture Radar (SAR) Images
- 5.3 Multiple Synthetic Aperture Radar (SAR) Images
Chapter 6 Market Estimates and Forecast, By Platform, 2022 - 2035 (USD Million)
- 6.1 Key trends
- 6.2 Airborne & spaceborne
- 6.3 Ground-based
- 6.4 Others
Chapter 7 Market Estimates and Forecast, By Component, 2022 - 2035 (USD Million)
- 7.1 Key trends
- 7.2 Hardware
- 7.3 Software
- 7.4 Services
Chapter 8 Market Estimates and Forecast, By Application, 2022 - 2035 (USD Million)
- 8.1 Key trends
- 8.2 Navigation
- 8.3 Impact assessment
- 8.3.1 Flood and drought
- 8.3.2 Seismic hazard
- 8.3.3 Open-pit mine
- 8.3.4 Others
- 8.4 Monitoring
- 8.4.1 Subsidence & field
- 8.4.2 Infrastructure stability
- 8.4.3 Glacier and ice sheet
- 8.4.4 Volcanic activity
- 8.4.5 Others
- 8.5 Mapping & planning
- 8.6 Others
Chapter 9 Market Estimates and Forecast, By End use, 2022 - 2035 (USD Million)
- 9.1 Key trends
- 9.2 Aerospace & defense
- 9.3 Agriculture
- 9.4 Civil engineering & construction
- 9.5 Environmental monitoring
- 9.6 Mining
- 9.7 Oil & gas
- 9.8 Others
Chapter 10 Market Estimates and Forecast, By Region, 2022 - 2035 (USD Million)
- 10.1 Key trends
- 10.2 North America
- 10.2.1 U.S.
- 10.2.2 Canada
- 10.3 Europe
- 10.3.1 Germany
- 10.3.2 UK
- 10.3.3 France
- 10.3.4 Spain
- 10.3.5 Italy
- 10.3.6 Netherlands
- 10.4 Asia Pacific
- 10.4.1 China
- 10.4.2 India
- 10.4.3 Japan
- 10.4.4 Australia
- 10.4.5 South Korea
- 10.5 Latin America
- 10.5.1 Brazil
- 10.5.2 Mexico
- 10.5.3 Argentina
- 10.6 Middle East and Africa
- 10.6.1 Saudi Arabia
- 10.6.2 South Africa
- 10.6.3 UAE
Chapter 11 Company Profiles
- 11.1 Global Key Players
- 11.1.1 Airbus Defence and Space
- 11.1.2 Lockheed Martin Corporation
- 11.1.3 Northrop Grumman Corporation
- 11.1.4 Raytheon Technologies
- 11.1.5 Thales Group
- 11.1.6 BAE Systems
- 11.1.7 Leonardo S.p.A.
- 11.1.8. L3 Harris Technologies
- 11.2 Regional Key Players
- 11.2.1 North America
- 11.2.1.1 Capella Space
- 11.2.1.2 MDA Ltd.
- 11.2.1.3 Orbital Insight
- 11.2.1.4 SkyGeo
- 11.2.2 Europe
- 11.2.2.1 GAMMA Remote Sensing AG
- 11.2.2.2 CGG
- 11.2.2.3 Tre Altamira
- 11.2.2.4 Tele-Rilevamento Europa
- 11.2.2.5 sarmap SA
- 11.2.3 Asia Pacific
- 11.2.3.1 ICEYE
- 11.2.3.2 Synspective
- 11.2.1 North America
- 11.3 Niche / Disruptors
- 11.3.1 3vGeomatics
- 11.3.2 GroundProbe
- 11.3.3 PCI Geomatics