|
시장보고서
상품코드
1740982
해양 전기 집진기 시장 : 시장 기회, 성장 촉진요인, 산업 동향 분석 및 예측(2025-2034년)Marine Electrostatic Precipitator Market Opportunity, Growth Drivers, Industry Trend Analysis, and Forecast 2025 - 2034 |
||||||
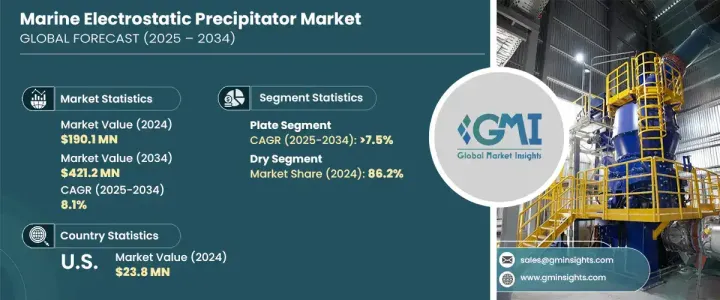
세계의 해양 전기 집진기 시장은 2024년에는 1억 9,010만 달러로 평가되었고, 2034년에는 4억 2,120만 달러에 달할 것으로 예측되며, CAGR 8.1%로 성장할 전망입니다.
이러한 성장은 기후 변화에 대한 전 세계의 관심이 높아지고 산업 전반, 특히 해양 부문에 대한 환경 규제가 강화됨에 따라 촉진되고 있습니다. 더 깨끗하고 지속 가능한 기술을 채택해야 한다는 국제적인 압력이 커지면서 해양 산업은 특히 환경에 민감한 지역에서 블랙 카본과 같은 유해한 배출물을 줄여야 하는 시급한 과제에 직면해 있습니다. 이에 따라 해운 회사들은 신규 선박과 기존 선박 모두에 전기집진장치(ESP)와 같은 첨단 배기가스 제어 시스템을 도입하는 사례가 늘고 있습니다.

전 세계 해운 업계가 친환경 솔루션과 탄소 감축 목표를 향해 나아감에 따라 ESP 시스템에 대한 수요는 더욱 증가하고 있습니다. 이러한 시스템은 선박용 디젤 엔진의 대기 중 미립자 배출을 제한하는 데 중요한 역할을 하며, 선박이 진화하는 국제 배출 기준을 충족하는 데 도움이 됩니다. 차세대 추진 및 배기가스 제어 기술에 대한 지속적인 투자로 ESP 시장은 강력한 성장 궤도를 유지할 것으로 예상됩니다. 이러한 추세는 운송 사업자가 운영 효율성과 규제 준수 사이에서 균형을 잡아야 하는 필요성에 의해 촉진되고 있습니다. 또한 배기가스 입자가 해양 생태계에 미치는 부정적인 영향에 대한 인식이 높아지면서 선박 내 오염 저감 기술의 도입이 더욱 촉진되고 있습니다.
| 시장 범위 | |
|---|---|
| 시작 연도 | 2024년 |
| 예측 연도 | 2025-2034년 |
| 시작 금액 | 1억 9,010만 달러 |
| 예측 금액 | 4억 2,120만 달러 |
| CAGR | 8.1% |
그러나 시장은 단기적으로 몇 가지 도전에 직면해 있으며, 특히 수입 부품 및 자재에 대한 관세로 인한 생산 비용 상승에 직면해 있습니다. 이러한 투입 비용 증가로 인해 일부 차량 사업자의 투자 결정이 지연될 수 있습니다. 그럼에도 불구하고 엄격한 배기가스 규제를 준수해야 하는 장기적인 필요성은 ESP 시스템에 대한 지속적인 수요를 보장합니다. 각국 정부가 더 엄격한 배기가스 배출 제한을 시행하고 지속 가능한 운송 관행을 장려함에 따라 ESP 시스템의 도입은 규정 준수 및 운영 생존을 위해 필수적인 요소로 남을 것입니다.
설계 트렌드와 관련하여 플레이트 기반 전기 집진기는 2025년부터 2034년까지 7.5%의 연평균 성장률을 보일 것으로 예상됩니다. 미세 입자를 포집하고 혹독한 해양 환경을 견딜 수 있는 탁월한 능력으로 인해 선호되는 선택입니다. 건식 전기 집진기는 2024년 시장에서 86.2%의 점유율을 차지하며 운영 효율성, 낮은 유지보수 필요성, 다양한 유형의 선박에 통합하기 쉽다는 이유로 선호도가 높았습니다. 글로벌 배기가스 배출 가이드라인 준수에 대한 관심이 높아지면서 특히 기존 선박의 개조와 신규 선박 건조에 집진기가 지속적으로 채택되고 있습니다.
미국의 해양 전기 집진기 시장은 2024년에 2,380만 달러에 이르렀으며, 해양오염을 억제하기 위한 강한 규제압력이 그 원동력이 되고 있습니다. 지속 가능한 해운 관행과 친환경 항만 인프라에 대한 투자를 지원하는 연방 노력은 미국 해역에서의 ESP 시스템 채택을 촉진했습니다. 캘리포니아 해안과 멕시코만과 같은 미국 해운 통로에서 환경 규정 준수가 점점 더 중요해지면서 효율적인 미립자 여과 기술에 대한 수요도 꾸준히 증가하고 있습니다.
세계의 해양 전기 집진기 업계의 주요 기업으로는 미쓰비시 중산업, GEA 그룹, 스미토모 중기계 산업, KC Cottrell India, McGill AirClean, Kraft Powercon, Valmet, Siemens Energy, 후지 전기, Andritz 그룹 등이 있습니다. 이러한 선도 기업들은 내구성, 컴팩트한 디자인, 내식성을 우선시하며 극한의 해양 환경에서도 견딜 수 있는 고성능 시스템을 제공합니다. 모듈식 시스템 구성에 초점을 맞추고 조선사 및 엔진 제조업체와 긴밀히 협력함으로써 이들 기업은 맞춤형의 비용 효율적인 솔루션을 통해 시장 입지를 지속적으로 강화하고 있습니다.
목차
제1장 조사 방법과 범위
제2장 주요 요약
제3장 업계 인사이트
- 업계 에코시스템
- 트럼프 정권의 관세 분석
- 무역에 미치는 영향
- 무역량의 혼란
- 보복조치
- 업계에 미치는 영향
- 공급측의 영향(원자재)
- 주요 원자재의 가격 변동
- 공급 체인 재구성
- 생산 비용에 미치는 영향
- 수요측의 영향(판매가격)
- 최종 시장에의 가격 전달
- 시장 점유율 동향
- 소비자의 반응 패턴
- 공급측의 영향(원자재)
- 영향을 받는 주요 기업
- 전략적인 업계 대응
- 공급망 재구성
- 가격 설정 및 제품 전략
- 정책관여
- 전망과 향후 검토 사항
- 무역에 미치는 영향
- 규제 상황
- 업계에 미치는 영향요인
- 성장 촉진요인
- 업계의 잠재적 위험 및 과제
- 성장 가능성 분석
- Porter's Five Forces 분석
- PESTEL 분석
제4장 경쟁 구도
- 소개
- 전략적 대시보드
- 혁신과 지속가능성의 정세
제5장 시장 규모와 예측 : 설계별(2021-2034년)
- 주요 동향
- 플레이트
- 관형
제6장 시장 규모와 예측 : 시스템별(2021-2034년)
- 주요 동향
- 건식
- 습식
제7장 시장 규모와 예측 : 지역별(2021-2034년)
- 주요 동향
- 북미
- 미국
- 캐나다
- 멕시코
- 유럽
- 독일
- 영국
- 프랑스
- 스페인
- 이탈리아
- 네덜란드
- 아시아태평양
- 중국
- 인도
- 일본
- 한국
- 인도네시아
- 호주
- 중동 및 아프리카
- 사우디아라비아
- 아랍에미리트(UAE)
- 남아프리카
- 나이지리아
- 앙골라
- 라틴아메리카
- 브라질
- 아르헨티나
- 칠레
- 페루
제8장 기업 프로파일
- ANDRITZ GROUP
- Fuji Electric
- GEA Group
- KC Cottrell India
- Kraft Powercon
- Mitsubishi Heavy Industries
- McGill AirClean
- Sumitomo Heavy Industries
- Siemens Energy
- Valmet
The Global Marine Electrostatic Precipitator Market was valued at USD 190.1 million in 2024 and is estimated to grow at a CAGR of 8.1% to reach USD 421.2 million by 2034. This growth is driven by the increasing global focus on climate change and the tightening of environmental regulations across industries, particularly the maritime sector. As international pressure mounts to adopt cleaner, more sustainable technologies, the maritime industry faces the urgent task of reducing harmful emissions, such as black carbon, particularly in environmentally sensitive areas. Consequently, shipping companies are increasingly incorporating advanced emission control systems, like electrostatic precipitators (ESPs), into both new vessels and their existing fleets.
As the global shipping industry navigates the shift towards green solutions and carbon reduction targets, the demand for ESP systems is intensifying. These systems play a crucial role in limiting airborne particulate emissions from marine diesel engines, helping vessels meet evolving international emission standards. With continued investments in next-generation propulsion and emission control technologies, the market for ESPs is set to maintain a strong growth trajectory. This trend is fueled by the need for shipping operators to balance operational efficiency with regulatory compliance. Additionally, growing awareness about the negative impact of exhaust particles on marine ecosystems is prompting further adoption of pollution mitigation technologies onboard ships.
| Market Scope | |
|---|---|
| Start Year | 2024 |
| Forecast Year | 2025-2034 |
| Start Value | $190.1 Million |
| Forecast Value | $421.2 Million |
| CAGR | 8.1% |
However, the market does face some short-term challenges, particularly rising production costs driven by tariffs on imported components and materials. These increased input costs may delay some fleet operators' investment decisions. Despite this, the long-term need to comply with stringent emission regulations ensures the continued demand for ESP systems. As governments enforce stricter emission caps and promote sustainable shipping practices, the adoption of ESP systems will remain essential for compliance and operational viability.
Regarding design trends, plate-based electrostatic precipitators are expected to see a CAGR of 7.5% between 2025 and 2034. Their superior ability to capture fine particulates and withstand the harsh maritime environment makes them a preferred choice. Dry electrostatic precipitators held an 86.2% share of the market in 2024, favored for their operational efficiency, lower maintenance needs, and ease of integration into various types of vessels. The rising focus on meeting global emission guidelines ensures continued adoption, especially for retrofitting existing fleets and new vessel constructions.
The U.S. Marine Electrostatic Precipitator Market reached USD 23.8 million in 2024, driven by strong regulatory pressures to curb maritime pollution. Federal initiatives supporting sustainable shipping practices and investment in green port infrastructure have fueled the adoption of ESP systems in U.S. waters. As environmental compliance becomes increasingly important along U.S. shipping corridors like the coasts of California and the Gulf of Mexico, the demand for efficient particulate filtration technologies is growing steadily.
Key players in the global marine electrostatic precipitator industry include Mitsubishi Heavy Industries, GEA Group, Sumitomo Heavy Industries, KC Cottrell India, McGill AirClean, Kraft Powercon, Valmet, Siemens Energy, Fuji Electric, and Andritz Group. These leading companies prioritize durability, compact design, and corrosion resistance, offering high-performance systems that can withstand extreme oceanic conditions. By focusing on modular system configurations and collaborating closely with shipbuilders and engine manufacturers, these companies continue to enhance their market position through tailored, cost-effective solutions.
Table of Contents
Chapter 1 Methodology & Scope
- 1.1 Research design
- 1.2 Base estimates & calculations
- 1.3 Forecast calculation
- 1.4 Primary research & validation
- 1.4.1 Primary sources
- 1.4.2 Data mining sources
- 1.5 Market definitions
Chapter 2 Executive Summary
- 2.1 Industry synopsis, 2021 – 2034
Chapter 3 Industry Insights
- 3.1 Industry ecosystem
- 3.2 Trump administration tariff analysis
- 3.2.1 Impact on trade
- 3.2.1.1 Trade volume disruptions
- 3.2.1.2 Retaliatory measures
- 3.2.2 Impact on the industry
- 3.2.2.1 Supply-side impact (raw materials)
- 3.2.2.1.1 Price volatility in key materials
- 3.2.2.1.2 Supply chain restructuring
- 3.2.2.1.3 Production cost implications
- 3.2.2.2 Demand-side impact (selling price)
- 3.2.2.2.1 Price transmission to end markets
- 3.2.2.2.2 Market share dynamics
- 3.2.2.2.3 Consumer response patterns
- 3.2.2.1 Supply-side impact (raw materials)
- 3.2.3 Key companies impacted
- 3.2.4 Strategic industry responses
- 3.2.4.1 Supply chain reconfiguration
- 3.2.4.2 Pricing and product strategies
- 3.2.4.3 Policy engagement
- 3.2.5 Outlook and future considerations
- 3.2.1 Impact on trade
- 3.3 Regulatory landscape
- 3.4 Industry impact forces
- 3.4.1 Growth drivers
- 3.4.2 Industry pitfalls & challenges
- 3.5 Growth potential analysis
- 3.6 Porter's analysis
- 3.6.1 Bargaining power of suppliers
- 3.6.2 Bargaining power of buyers
- 3.6.3 Threat of new entrants
- 3.6.4 Threat of substitutes
- 3.7 PESTEL analysis
Chapter 4 Competitive landscape, 2024
- 4.1 Introduction
- 4.2 Strategic dashboard
- 4.3 Innovation & sustainability landscape
Chapter 5 Market Size and Forecast, By Design, 2021 – 2034(USD Million)
- 5.1 Key trends
- 5.2 Plate
- 5.3 Tubular
Chapter 6 Market Size and Forecast, By System, 2021 – 2034(USD Million)
- 6.1 Key trends
- 6.2 Dry
- 6.3 Wet
Chapter 7 Market Size and Forecast, By Region, 2021 – 2034(USD Million)
- 7.1 Key trends
- 7.2 North America
- 7.2.1 U.S.
- 7.2.2 Canada
- 7.2.3 Mexico
- 7.3 Europe
- 7.3.1 Germany
- 7.3.2 UK
- 7.3.3 France
- 7.3.4 Spain
- 7.3.5 Italy
- 7.3.6 Netherlands
- 7.4 Asia Pacific
- 7.4.1 China
- 7.4.2 India
- 7.4.3 Japan
- 7.4.4 South Korea
- 7.4.5 Indonesia
- 7.4.6 Australia
- 7.5 Middle East & Africa
- 7.5.1 Saudi Arabia
- 7.5.2 UAE
- 7.5.3 South Africa
- 7.5.4 Nigeria
- 7.5.5 Angola
- 7.6 Latin America
- 7.6.1 Brazil
- 7.6.2 Argentina
- 7.6.3 Chile
- 7.6.4 Peru
Chapter 8 Company Profiles
- 8.1 ANDRITZ GROUP
- 8.2 Fuji Electric
- 8.3 GEA Group
- 8.4 KC Cottrell India
- 8.5 Kraft Powercon
- 8.6 Mitsubishi Heavy Industries
- 8.7 McGill AirClean
- 8.8 Sumitomo Heavy Industries
- 8.9 Siemens Energy
- 8.10 Valmet