|
시장보고서
상품코드
1822639
지오폼 시장 : 기회, 성장 촉진요인, 산업 동향 분석 및 예측(2025-2034년)Geofoam Market Opportunity, Growth Drivers, Industry Trend Analysis, and Forecast 2025 - 2034 |
||||||
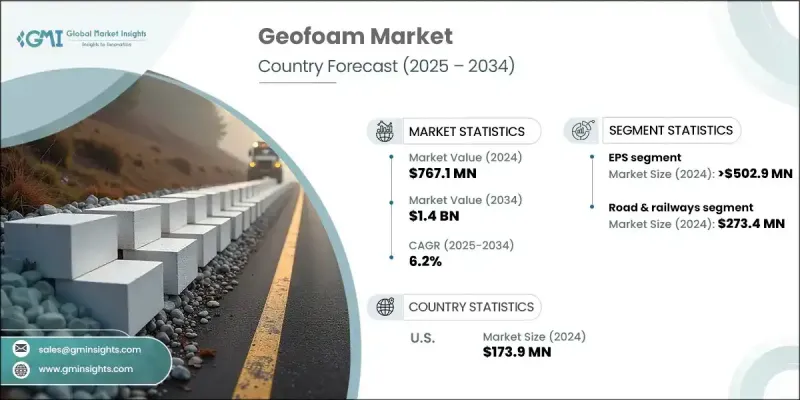
세계의 지오폼 시장 규모는 2024년에 7억 6,710만 달러로 평가되었고, CAGR은 6.2%를 나타낼 것으로 예측되며 2034년에 14억 달러에 이를 전망입니다. 이러한 성장은 주로 인프라 개발에서 경량이며 내구성 있는 건설 자재에 대한 수요 증가에 의해 촉진됩니다. 전 세계, 특히 개발도상국에서 도시화가 급속히 진행됨에 따라 지오폼과 같은 고하중 지지 재료에 대한 필요성이 점점 더 중요해지고 있습니다. 지오폼의 경량 구성은 운송을 단순화할 뿐만 아니라 구조적 하중을 감축하여 둑, 활주로, 사면 보강과 같은 토양 안정화가 필요한 프로젝트에 선호되는 재료로 자리매김하고 있습니다.

지오폼은 구조물의 하중을 상당한 수준으로 낮출 수 있는 능력으로 인프라의 내구성과 안정성을 향상시키는 데 있어 귀중한 자산입니다. 산업 보고서에 따르면 건설 분야에서 지오폼 사용량이 꾸준히 증가하고 있으며, 특히 북미 지역에서 지난 5년간 도입률이 지속적으로 상승했습니다. 이러한 동향은 복잡한 건설 수요에 대한 비용 효율적이고 효과적인 솔루션을 제공하는 지오폼의 역할이 점점 더 인정받고 있음을 보여줍니다.
| 시장 범위 | |
|---|---|
| 시작 연도 | 2024년 |
| 예측 연도 | 2025-2034년 |
| 시장 규모 | 7억 6,710만 달러 |
| 예측 금액 | 14억 달러 |
| CAGR | 6.2% |
다양한 지오폼 유형 중 발포 폴리스티렌(EPS)은 2023년 4억 8,540만 달러의 시장 점유율을 기록했으며, 2032년까지 연평균 6.4%의 성장률을 보일 것으로 예상됩니다. EPS는 경량 특성, 비용 효율성, 다양한 용도에서의 적응성으로 인해 시장을 계속 주도하고 있습니다. 열 절연 능력과 성형 용이성 덕분에 특히 옹벽 및 도로 공사와 같은 건설 프로젝트에 다용도로 활용됩니다. 다른 대체재에 비해 가격 경쟁력이 있어 대규모 인프라 사업에서 특히 널리 사용되고 있습니다.
유통 채널 측면에서, 2023년 지오폼 시장의 65.6%를 기록된 직접 판매 채널은 2032년까지 연평균 6.4%의 성장률을 보일 것으로 예상됩니다. 맞춤형 솔루션이 필요한 대규모 프로젝트에서는 제조업체가 고객과 긴밀히 협력하여 맞춤형 지오폼 제품 및 서비스를 제공할 수 있는 직접 유통이 선호되는 경우가 많습니다. 이러한 접근 방식은 프로젝트별 요구 사항을 정밀하고 효율적으로 충족시켜 고객 만족도와 프로젝트 성과를 향상시킵니다.
미국의 지오폼 시장만 해도 2023년 1억 6,790만 달러를 넘어섰으며, 2032년까지 유사한 성장세를 보일 것으로 예상됩니다. 이 소재의 경량 구조와 뛰어난 하중 지지 능력은 핵심 인프라 프로젝트에 이상적인 선택으로, 해당 지역 건설 산업에서의 중요성을 더욱 공고히 하고 있습니다.
목차
제1장 조사 방법과 범위
제2장 주요 요약
제3장 업계 인사이트
- 생태계 분석
- 공급자의 상황
- 이익률
- 각 단계에서의 부가가치
- 밸류체인에 영향을 주는 요인
- 업계에 미치는 영향요인
- 성장 촉진요인
- 인프라 개발 확대
- 환경상의 이점과 지속가능성
- 비용과 시간의 효율성
- 업계의 잠재적 위험 및 과제
- 한정된 인식과 지식
- 환경 문제와 규제
- 기회
- 지속 가능한 건설 확대
- 첨단 지오폼 소재 개발
- 성장 촉진요인
- 성장 가능성 분석
- 장래 시장 동향
- 기술과 혁신 상황
- 현재 기술 동향
- 신흥 기술
- 가격 동향
- 지역별
- 유형별
- 규제 상황
- 표준 및 규제 준수 요건
- 지역 규제 프레임워크
- 인증 기준
- Porter's Five Forces 분석
- PESTEL 분석
제4장 경쟁 구도
- 소개
- 기업의 시장 점유율 분석
- 지역별
- 기업 매트릭스 분석
- 주요 시장 기업의 경쟁 분석
- 경쟁 포지셔닝 매트릭스
- 주요 발전
- 합병과 인수
- 파트너십 및 협업
- 신제품 발매
- 확장 계획
제5장 시장 추계 및 예측 : 유형별(2021-2034년)
- 주요 동향
- EPS
- XPS
제6장 시장 추계 및 예측 : 밀도별(2021-2034년)
- 주요 동향
- 저밀도
- 중밀도
- 고밀도
제7장 시장 추계 및 예측 : 용도별(2021-2034년)
- 주요 동향
- 공극 충전
- 사면 안정화
- 제방
- 옹벽 구조
- 단열
- 기타
제8장 시장 추계 및 예측 : 최종 용도별(2021-2034년)
- 주요 동향
- 도로 및 철도
- 건물 및 인프라
- 공항 인프라
- 조경
- 기타
제9장 시장 추계 및 예측 : 유통 채널별(2021-2034년)
- 주요 동향
- 직접
- 간접
제10장 시장 추계 및 예측 : 지역별(2021-2034년)
- 주요 동향
- 북미
- 미국
- 캐나다
- 유럽
- 독일
- 영국
- 프랑스
- 이탈리아
- 스페인
- 아시아태평양
- 중국
- 일본
- 인도
- 호주
- 한국
- 라틴아메리카
- 브라질
- 멕시코
- 아르헨티나
- 중동 및 아프리카
- 남아프리카
- 사우디아라비아
- 아랍에미리트(UAE)
제11장 기업 프로파일
- Alleguard
- Atlas Molded Products
- Beaver Plastics
- Benchmark Foam
- Carlisle Companies
- Cellofoam North America Inc
- EXPOL
- Galaxy Polystyrene LLC
- Geofoam America
- Geofoam International LLC
- Legerlite
- Pacific Allied Products Ltd
- Technopol SA
- ThermaFoam, LLC
- Universal Construction Foam
The global geofoam market was valued at USD 767.1 million in 2024 and is estimated to grow at a CAGR of 6.2% to reach USD 1.4 billion by 2034. This growth is largely driven by the rising demand for lightweight and durable construction materials in infrastructure development. As urbanization continues to surge globally, particularly in developing economies, the need for high-load-bearing materials like geofoam is becoming increasingly critical. Its lightweight composition not only simplifies transportation but also reduces structural loads, making it a preferred material for projects requiring soil stabilization, such as embankments, runways, and slope reinforcement.
Geofoam's ability to significantly lower dead loads on structures makes it a valuable asset in enhancing the durability and stability of infrastructure. Industry reports indicate a steady rise in geofoam usage in construction, particularly in North America, where adoption rates have consistently grown over the past five years. This trend highlights the growing recognition of geofoam's role in delivering cost-effective and efficient solutions for complex construction needs.
| Market Scope | |
|---|---|
| Start Year | 2024 |
| Forecast Year | 2025-2034 |
| Start Value | $767.1 million |
| Forecast Value | $1.4 billion |
| CAGR | 6.2% |
Among the various types of geofoam, Expanded Polystyrene (EPS) held a market share valued at USD 485.4 million in 2023 and is expected to expand at a 6.4% CAGR through 2032. EPS continues to dominate due to its lightweight properties, cost efficiency, and adaptability across a range of applications. Its thermal insulation capabilities and ease of shaping make it a versatile choice for construction projects, particularly those involving retaining walls and roadways. Compared to other alternatives, EPS offers a competitive advantage in pricing, which further fuels its widespread use, especially in large-scale infrastructure initiatives.
In terms of distribution, the direct sales channel accounted for 65.6% of the geofoam market in 2023 and is anticipated to grow at a 6.4% CAGR through 2032. Direct distribution is often preferred for large projects that require customized solutions, allowing manufacturers to closely collaborate with clients and provide tailored geofoam products and services. This approach ensures that project-specific requirements are met with precision and efficiency, enhancing customer satisfaction and project outcomes.
The U.S. geofoam market alone surpassed USD 167.9 million in 2023 and is expected to grow at a similar pace through 2032. The material's lightweight structure and impressive load-bearing capabilities make it an ideal choice for critical infrastructure projects, reinforcing its importance in the construction industry across the region.
Table of Contents
Chapter 1 Methodology and Scope
- 1.1 Market scope and definition
- 1.2 Research design
- 1.2.1 Research approach
- 1.2.2 Data collection methods
- 1.3 Data mining sources
- 1.3.1 Global
- 1.3.2 Regional/Country
- 1.4 Base estimates and calculations
- 1.4.1 Base year calculation
- 1.4.2 Key trends for market estimation
- 1.5 Primary research and validation
- 1.5.1 Primary sources
- 1.6 Forecast model
- 1.7 Research assumptions and limitations
Chapter 2 Executive Summary
- 2.1 Industry 3600 synopsis
- 2.2 Key market trends
- 2.2.1 Regional
- 2.2.2 Type
- 2.2.3 Density
- 2.2.4 Application
- 2.2.5 End use
- 2.2.6 Distribution channel
- 2.3 CXO perspectives: Strategic imperatives
- 2.3.1 Key decision points for industry executives
- 2.3.2 Critical success factors for market players
- 2.4 Future outlook and strategic recommendations
Chapter 3 Industry Insights
- 3.1 Industry ecosystem analysis
- 3.1.1 Supplier landscape
- 3.1.2 Profit margin
- 3.1.3 Value addition at each stage
- 3.1.4 Factor affecting the value chain
- 3.2 Industry impact forces
- 3.2.1 Growth drivers
- 3.2.1.1 Growing infrastructure development
- 3.2.1.2 Environmental benefits and sustainability
- 3.2.1.3 Cost and time efficiency
- 3.2.2 Industry pitfalls & challenges
- 3.2.2.1 Limited awareness and knowledge
- 3.2.2.2 Environmental concerns and regulations
- 3.2.3 Opportunities
- 3.2.3.1 Expansion in sustainable construction
- 3.2.3.2 Development of advanced geofoam materials
- 3.2.1 Growth drivers
- 3.3 Growth potential analysis
- 3.4 Future market trends
- 3.5 Technology and innovation landscape
- 3.5.1 Current technological trends
- 3.5.2 Emerging technologies
- 3.6 Price trends
- 3.6.1 By region
- 3.6.2 By type
- 3.7 Regulatory landscape
- 3.7.1 Standards and compliance requirements
- 3.7.2 Regional regulatory frameworks
- 3.7.3 Certification standards
- 3.8 Porter's analysis
- 3.9 PESTEL analysis
Chapter 4 Competitive Landscape, 2024
- 4.1 Introduction
- 4.2 Company market share analysis
- 4.2.1 By region
- 4.2.1.1 North America
- 4.2.1.2 Europe
- 4.2.1.3 Asia Pacific
- 4.2.1.4 Latin America
- 4.2.1.5 Middle East and Africa
- 4.2.1 By region
- 4.3 Company matrix analysis
- 4.4 Competitive analysis of major market players
- 4.5 Competitive positioning matrix
- 4.6 Key developments
- 4.6.1 Mergers & acquisitions
- 4.6.2 Partnerships & collaborations
- 4.6.3 New product launches
- 4.6.4 Expansion plans
Chapter 5 Market Estimates and Forecast, By Type, 2021 - 2034 (USD Million) (Thousand Square Meters)
- 5.1 Key trends
- 5.2 EPS
- 5.3 XPS
Chapter 6 Market Estimates and Forecast, By Density, 2021 - 2034 (USD Million) (Thousand Square Meters)
- 6.1 Key trends
- 6.2 Low
- 6.3 Medium
- 6.4 High
Chapter 7 Market Estimates and Forecast, By Application, 2021 - 2034 (USD Million) (Thousand Square Meters)
- 7.1 Key trends
- 7.2 Void fill
- 7.3 Slope stabilization
- 7.4 Embankments
- 7.5 Retaining structures
- 7.6 Insulation
- 7.7 Others
Chapter 8 Market Estimates and Forecast, By End Use, 2021 - 2034 (USD Million) (Thousand Square Meters)
- 8.1 Key trends
- 8.2 Road & railways
- 8.3 Building & infrastructure
- 8.4 Airport infrastructure
- 8.5 Landscaping
- 8.6 Others
Chapter 9 Market Estimates and Forecast, By Distribution Channel, 2021 - 2034 (USD Million) (Thousand Square Meters)
- 9.1 Key trends
- 9.2 Direct
- 9.3 Indirect
Chapter 10 Market Estimates and Forecast, By Region, 2021 - 2034 (USD Million) (Thousand Square Meters)
- 10.1 Key trends
- 10.2 North America
- 10.2.1 U.S.
- 10.2.2 Canada
- 10.3 Europe
- 10.3.1 Germany
- 10.3.2 UK
- 10.3.3 France
- 10.3.4 Italy
- 10.3.5 Spain
- 10.4 Asia Pacific
- 10.4.1 China
- 10.4.2 Japan
- 10.4.3 India
- 10.4.4 Australia
- 10.4.5 South Korea
- 10.5 Latin America
- 10.5.1 Brazil
- 10.5.2 Mexico
- 10.5.3 Argentina
- 10.6 Middle East and Africa
- 10.6.1 South Africa
- 10.6.2 Saudi Arabia
- 10.6.3 UAE
Chapter 11 Company Profiles
- 11.1 Alleguard
- 11.2 Atlas Molded Products
- 11.3 Beaver Plastics
- 11.4 Benchmark Foam
- 11.5 Carlisle Companies
- 11.6 Cellofoam North America Inc
- 11.7 EXPOL
- 11.8 Galaxy Polystyrene LLC
- 11.9 Geofoam America
- 11.10 Geofoam International LLC
- 11.11 Legerlite
- 11.12 Pacific Allied Products Ltd
- 11.13 Technopol SA
- 11.14 ThermaFoam, LLC
- 11.15 Universal Construction Foam