|
시장보고서
상품코드
1892757
참치 통조림 시장 기회, 성장요인, 업계 동향 분석 및 예측(2026-2035년)Canned Tuna Market Opportunity, Growth Drivers, Industry Trend Analysis, and Forecast 2026 - 2035 |
||||||
세계의 참치 통조림 시장은 2025년에 125억 달러로 평가되었고, 2035년까지 연평균 복합 성장률(CAGR) 4.5%로 성장하여 194억 달러에 이를 것으로 예측됩니다.

참치 통조림은 참치를 기름, 물, 소금물과 함께 통조림으로 만든 보존 식품으로, 가정에서 간편하고 장기 보관이 가능한 단백질 공급원으로 널리 이용되고 있습니다. 저렴한 가격, 높은 영양가, 간편한 조리법으로 인해 전 세계 가정에서 필수품으로 자리 잡았습니다. 고단백 식단과 건강 식품에 대한 소비자의 관심이 높아지면서 수요가 증가하고 있으며, 참치 통조림은 건강에 관심이 많은 사람들에게 이상적인 저지방 단백질 공급원을 제공합니다. 세계 각국의 정부와 보건 기관은 특히 노인과 건강 지향적인 젊은 세대를 대상으로 단백질 섭취를 권장하고 있으며, 참치 통조림이 전반적인 건강 유지와 식단 목표 달성에 중요한 역할을 하고 있음을 강조하고 있습니다.
| 시장 범위 | |
|---|---|
| 개시 연도 | 2025년 |
| 예측 연도 | 2026-2035년 |
| 개시 연도 시장 규모 | 125억 달러 |
| 예측 금액 | 194억 달러 |
| CAGR | 4.5% |
2024년 기준 가다랑어 부문은 52.2%의 점유율을 차지하고 있으며, 2035년까지 연평균 4.6%의 성장률을 보일 것으로 예측됩니다. 광범위한 가용성, 저렴한 가격, 그리고 순한 맛이 그 우위에 기여하고 있습니다. 열대 해역에서는 가다랑어가 풍부하게 공급되기 때문에 제조업체의 조달 비용이 절감되어 경쟁력 있는 가격 책정이 가능합니다. 안정적인 공급망과 순한 맛을 선호하는 소비자의 취향이 시장에서의 입지를 더욱 강화하고 있습니다.
청크 참치 부문은 2025년 52.2%의 점유율을 차지할 것으로 예상되며, 매력적인 식감과 다재다능한 특성으로 인해 계속해서 선두를 유지할 것으로 보입니다. 참다랑어는 샐러드, 샌드위치, 즉석조리식품 등으로 소비자와 식품업체 모두 선호하고 있으며, 소매 및 외식 산업 채널 전반에서 높은 수요가 예상되는 제품입니다.
북미 참치캔 시장은 2026년부터 2035년까지 연평균 복합 성장률(CAGR) 4.6%로 확대될 것으로 예상되며, 미국에서만 2025년 30억 달러 규모에 달할 것으로 전망됩니다. 건강과 지속가능성에 대한 소비자의 인식이 높아지면서 책임감 있는 조달 방식을 통한 유기농 참치 통조림에 대한 수요가 증가하고 있습니다. 각 업체들은 지속가능한 어획량을 확보하기 위해 선택적 어구 사용, 선박 추적 기술 도입 등 환경 친화적인 어획 방식을 채택하고 있습니다. 경량화 및 재활용 가능한 소재를 포함한 포장 기술 혁신은 환경 친화적인 소비자에게 어필할 수 있는 동시에 규제 및 업계의 지속가능성 기준을 충족합니다.
자주 묻는 질문
목차
제1장 조사 방법과 범위
제2장 주요 요약
제3장 업계 인사이트
- 생태계 분석
- 공급업체 상황
- 이익률
- 각 단계별 부가가치
- 밸류체인에 영향을 미치는 요인
- 파괴적 변화
- 업계에 대한 영향요인
- 성장 촉진요인
- 업계의 잠재적 리스크&과제
- 시장 기회
- 성장 가능성 분석
- 규제 상황
- 북미
- 유럽
- 아시아태평양
- 라틴아메리카
- 중동 및 아프리카
- Porter's Five Forces 분석
- PESTEL 분석
- 가격 동향
- 지역별
- 유형별
- 향후 시장 동향
- 기술과 혁신 동향
- 현재 기술 동향
- 신기술
- 특허 상황
- 무역 통계(HS코드)(주 : 무역 통계는 주요 국가에 한해 제공됩니다)
- 주요 수입국
- 주요 수출국
- 지속가능성과 환경면
- 지속가능한 대처
- 폐기물 감축 전략
- 생산 에너지 효율
- 친환경 이니셔티브
- 탄소발자국 고려
제4장 경쟁 구도
- 서론
- 기업의 시장 점유율 분석
- 지역별
- 북미
- 유럽
- 아시아태평양
- 라틴아메리카
- 중동 및 아프리카
- 지역별
- 기업 매트릭스 분석
- 주요 시장 기업의 경쟁 분석
- 경쟁 포지셔닝 매트릭스
- 주요 발전
- 인수합병(M&A)
- 제휴 및 협업
- 신제품 발매
- 사업 확대 계획
제5장 시장 추산 및 예측 : 유형별, 2022-2035
- 주요 동향
- 알바코어
- 가다랑어
- 황다랑어
- 큰눈다랑어
- 참다랑어
- 통골/롱테일
- 기타
제6장 시장 추산 및 예측 : 제품 형태별, 2022-2035
- 주요 동향
- 고체
- 덩어리
- 플레이크
- 훈제
- 기타
제7장 시장 추산 및 예측 : 용기 유형별, 2022-2035
- 주요 동향
- 금속 캔
- 플렉시블 파우치(레토르트 파우치)
- 유리병
- 기타
제8장 시장 추산 및 예측 : 최종 용도별, 2022-2035
- 주요 동향
- 소매 및 가정 소비
- 외식 산업(레스토랑, 호텔, 케이터링)
- 기관(학교, 병원, 군, 기업)
- 식품 가공 및 제조
- 반려동물 사료
- 기타
제9장 시장 추산 및 예측 : 유통 채널별, 2022-2035
- 주요 동향
- 양판점(슈퍼마켓 및 하이퍼마켓, 창고형 회원제점)
- 편의점
- 온라인 소매 및 전자상거래
- 전문점 및 건강식품점
- 외식 산업 도매업체
- 수출 및 국제 유통업체
- 기타
제10장 시장 추산 및 예측 : 지역별, 2022-2035
- 주요 동향
- 북미
- 미국
- 캐나다
- 유럽
- 독일
- 영국
- 프랑스
- 스페인
- 이탈리아
- 기타 유럽
- 아시아태평양
- 중국
- 인도
- 일본
- 호주
- 한국
- 기타 아시아태평양
- 라틴아메리카
- 브라질
- 멕시코
- 아르헨티나
- 기타 라틴아메리카
- 중동 및 아프리카
- 사우디아라비아
- 남아프리카공화국
- 아랍에미리트(UAE)
- 기타 중동 및 아프리카
제11장 기업 개요
- American Tuna
- Bumble Bee Foods
- Century Pacific Food
- Crown Prince
- Dongwon Group
- Nauterra
- Princes Food
- Safe Catch
- StarKist Co.
- Thai Union Group
- Wild Planet Foods
The Global Canned Tuna Market was valued at USD 12.5 billion in 2025 and is estimated to grow at a CAGR of 4.5% to reach USD 19.4 billion by 2035.
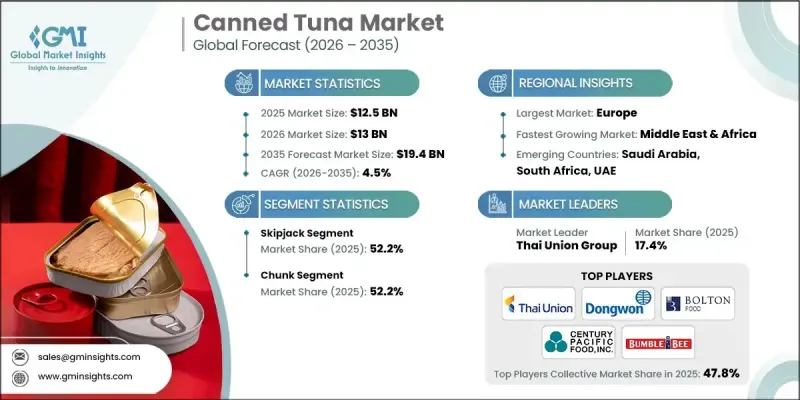
Canned tuna is a preserved seafood product where tuna is stored in cans with oil, water, or brine, offering a convenient and long-lasting source of protein. Its affordability, nutritional benefits, and ease of preparation make it a staple in households worldwide. Rising consumer interest in high-protein diets and healthier food options has fueled demand, as canned tuna provides a lean protein source ideal for fitness-conscious individuals. Governments and health organizations globally encourage protein consumption, particularly among the elderly and health-oriented younger populations, highlighting the role of canned tuna in maintaining overall wellness and supporting dietary goals.
| Market Scope | |
|---|---|
| Start Year | 2025 |
| Forecast Year | 2026-2035 |
| Start Value | $12.5 Billion |
| Forecast Value | $19.4 Billion |
| CAGR | 4.5% |
The skipjack tuna segment held a 52.2% share in 2024 and is expected to grow at a CAGR of 4.6% through 2035. Its widespread availability, low cost, and mild flavor contribute to its dominance. Tropical waters supply skipjack abundantly, reducing sourcing costs for manufacturers and enabling competitive pricing. Its steady supply chain and consumer preference for milder taste profiles further bolster its market position.
The chunk tuna segment accounted for a 52.2% share in 2025 and continues to lead due to its appealing texture and versatility. Chunk tuna is favored by consumers and food manufacturers alike for salads, sandwiches, and ready-to-eat meals, making it a highly sought-after product across retail and food service channels.
North America Canned Tuna Market is expected to grow at a CAGR of 4.6% between 2026 and 2035, with the U.S. alone accounting for USD 3 billion in 2025. Growing consumer awareness around health and sustainability is driving demand for responsibly sourced and organic canned tuna. Manufacturers are adopting eco-friendly fishing practices, using selective gear and vessel tracking technologies to ensure sustainable harvesting. Packaging innovations, including lightweight and recyclable materials, further appeal to environmentally conscious consumers while meeting regulatory and industry sustainability standards.
Key players in the Canned Tuna Market include American Tuna, Bumble Bee Foods, Century Pacific Food, Crown Prince, Dongwon Group, Nauterra, Princes Food, Safe Catch, StarKist Co., Thai Union Group, and Wild Planet Foods. Companies in the canned tuna market are enhancing their market foothold through strategies like sustainable sourcing and responsible fishing practices, which appeal to eco-conscious consumers and regulatory bodies. Investment in innovative, eco-friendly packaging reduces environmental impact while attracting premium buyers. Firms are also expanding their global distribution networks, forging strategic partnerships with retailers and food service providers to increase product availability. Marketing campaigns emphasizing health benefits, quality, and traceability help build brand loyalty. Additionally, companies focus on research and development to diversify product lines, including organic, low-sodium, and specialty flavored options, to cater to evolving consumer preferences and strengthen their competitive position.
Table of Contents
Chapter 1 Methodology & Scope
- 1.1 Market scope and definition
- 1.2 Research design
- 1.2.1 Research approach
- 1.2.2 Data collection methods
- 1.3 Data mining sources
- 1.3.1 Global
- 1.3.2 Regional/Country
- 1.4 Base estimates and calculations
- 1.4.1 Base year calculation
- 1.4.2 Key trends for market estimation
- 1.5 Primary research and validation
- 1.5.1 Primary sources
- 1.6 Forecast model
- 1.7 Research assumptions and limitations
Chapter 2 Executive Summary
- 2.1 Industry 360° synopsis
- 2.2 Key market trends
- 2.2.1 Regional
- 2.2.2 Type
- 2.2.3 Product form
- 2.2.4 Container type
- 2.2.5 End Use
- 2.2.6 Distribution channel
- 2.3 TAM Analysis, 2026-2035
- 2.4 CXO perspectives: Strategic imperatives
- 2.4.1 Executive decision points
- 2.4.2 Critical success factors
- 2.5 Future Outlook and Strategic Recommendations
Chapter 3 Industry Insights
- 3.1 Industry ecosystem analysis
- 3.1.1 Supplier landscape
- 3.1.2 Profit margin
- 3.1.3 Value addition at each stage
- 3.1.4 Factor affecting the value chain
- 3.1.5 Disruptions
- 3.2 Industry impact forces
- 3.2.1 Growth drivers
- 3.2.1.1 Increasing protein diet
- 3.2.1.2 Expansion of the food industry
- 3.2.1.3 Convenience trend driving flavored & pouch formats
- 3.2.2 Industry pitfalls and challenges
- 3.2.2.1 Price volatility of tuna
- 3.2.2.2 Competition from alternative proteins
- 3.2.3 Market opportunities
- 3.2.3.1 Growing demand for ready-to-eat protein options
- 3.2.3.2 Rising interest in eco-friendly packaging
- 3.2.1 Growth drivers
- 3.3 Growth potential analysis
- 3.4 Regulatory landscape
- 3.4.1 North America
- 3.4.2 Europe
- 3.4.3 Asia Pacific
- 3.4.4 Latin America
- 3.4.5 Middle East & Africa
- 3.5 Porter's analysis
- 3.6 PESTEL analysis
- 3.7 Price trends
- 3.7.1 By region
- 3.7.2 By type
- 3.8 Future market trends
- 3.9 Technology and Innovation landscape
- 3.9.1 Current technological trends
- 3.9.2 Emerging technologies
- 3.10 Patent Landscape
- 3.11 Trade statistics (HS code) ( Note: the trade statistics will be provided for key countries only)
- 3.11.1 Major importing countries
- 3.11.2 Major exporting countries
- 3.12 Sustainability and environmental aspects
- 3.12.1 Sustainable practices
- 3.12.2 Waste reduction strategies
- 3.12.3 Energy efficiency in production
- 3.12.4 Eco-friendly initiatives
- 3.13 Carbon footprint consideration
Chapter 4 Competitive Landscape, 2025
- 4.1 Introduction
- 4.2 Company market share analysis
- 4.2.1 By region
- 4.2.1.1 North America
- 4.2.1.2 Europe
- 4.2.1.3 Asia Pacific
- 4.2.1.4 LATAM
- 4.2.1.5 MEA
- 4.2.1 By region
- 4.3 Company matrix analysis
- 4.4 Competitive analysis of major market players
- 4.5 Competitive positioning matrix
- 4.6 Key developments
- 4.6.1 Mergers & acquisitions
- 4.6.2 Partnerships & collaborations
- 4.6.3 New Product Launches
- 4.6.4 Expansion Plans
Chapter 5 Market Estimates and Forecast, By Type, 2022-2035 (USD Billion) (Kilo Tons)
- 5.1 Key trends
- 5.2 Albacore
- 5.3 Skipjack
- 5.4 Yellowfin
- 5.5 Bigeye
- 5.6 Bluefin
- 5.7 Tongol/longtail
- 5.8 Others
Chapter 6 Market Estimates and Forecast, By Product Form, 2022-2035 (USD Billion) (Kilo Tons)
- 6.1 Key trends
- 6.2 Solid
- 6.3 Chunk
- 6.4 Flake
- 6.5 Smoked
- 6.6 Others
Chapter 7 Market Estimates and Forecast, By Container Type, 2022-2035 (USD Billion) (Kilo Tons)
- 7.1 Key trends
- 7.2 Metal cans
- 7.3 Flexible pouches (retort pouches)
- 7.4 Glass jars
- 7.5 Others
Chapter 8 Market Estimates and Forecast, By End Use, 2022-2035 (USD Billion) (Kilo Tons)
- 8.1 Key trends
- 8.2 Retail/household consumption
- 8.3 Foodservice (restaurants, hotels, catering)
- 8.4 Institutional (schools, hospitals, military, corporate)
- 8.5 Food processing & manufacturing
- 8.6 Pet food
- 8.7 Others
Chapter 9 Market Estimates and Forecast, By Distribution Channel, 2022-2035 (USD Billion) (Kilo Tons)
- 9.1 Key trends
- 9.2 Mass retailers (supermarkets, hypermarkets, warehouse clubs)
- 9.3 Convenience stores
- 9.4 Online retail & e-commerce
- 9.5 Specialty & health food stores
- 9.6 Foodservice distributors
- 9.7 Export/international distributors
- 9.8 Others
Chapter 10 Market Estimates and Forecast, By Region, 2022-2035 (USD Billion) (Kilo Tons)
- 10.1 Key trends
- 10.2 North America
- 10.2.1 U.S.
- 10.2.2 Canada
- 10.3 Europe
- 10.3.1 Germany
- 10.3.2 UK
- 10.3.3 France
- 10.3.4 Spain
- 10.3.5 Italy
- 10.3.6 Rest of Europe
- 10.4 Asia Pacific
- 10.4.1 China
- 10.4.2 India
- 10.4.3 Japan
- 10.4.4 Australia
- 10.4.5 South Korea
- 10.4.6 Rest of Asia Pacific
- 10.5 Latin America
- 10.5.1 Brazil
- 10.5.2 Mexico
- 10.5.3 Argentina
- 10.5.4 Rest of Latin America
- 10.6 Middle East and Africa
- 10.6.1 Saudi Arabia
- 10.6.2 South Africa
- 10.6.3 UAE
- 10.6.4 Rest of Middle East and Africa
Chapter 11 Company Profiles
- 11.1 American Tuna
- 11.2 Bumble Bee Foods
- 11.3 Century Pacific Food
- 11.4 Crown Prince
- 11.5 Dongwon Group
- 11.6 Nauterra
- 11.7 Princes Food
- 11.8 Safe Catch
- 11.9 StarKist Co.
- 11.10 Thai Union Group
- 11.11 Wild Planet Foods