


|
시장보고서
상품코드
1750567
압력계 시장 기회, 성장 촉진요인, 산업 동향 분석 및 예측(2025-2034년)Pressure Gauges Market Opportunity, Growth Drivers, Industry Trend Analysis, and Forecast 2025 - 2034 |
||||||
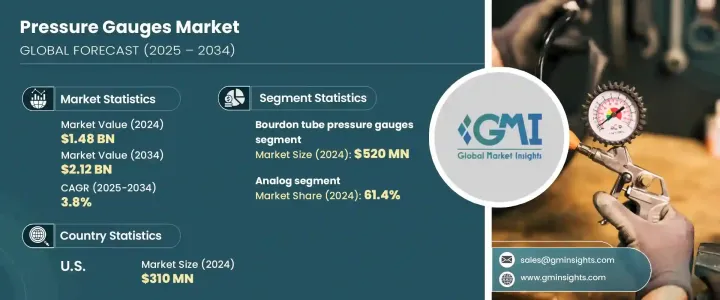
세계의 압력계 시장은 2024년에는 14억 8,000만 달러로 평가되었고, CAGR 3.8%를 나타내 2034년에는 21억 2,000만 달러에 이를 것으로 예측되고 있습니다. 각 산업에서 업무 자동화가 진행됨에 따라 신뢰성이 높고 통합된 압력 모니터링 솔루션의 필요성이 더욱 높아지고 있습니다.
제조 시설, 정유소 및 기타 산업 환경에서는 작업 효율과 기계 보호가 중요합니다. 특히 아시아태평양과 라틴아메리카에서는 산업활동의 활성화에 따라 수요가 더욱 높아지고 있습니다.
| 시장 범위 | |
|---|---|
| 시작 연도 | 2024년 |
| 예측 연도 | 2025-2034년 |
| 시작 금액 | 14억 8,000만 달러 |
| 예측 금액 | 21억 2,000만 달러 |
| CAGR | 3.8% |
Industry 4.0의 진전으로 스마트 기술의 통합이 진행되고 압력계 시장은 크게 변화하고 있습니다. 정확성과 프로세스 최적화가 필수적인 분야에서 급속한 속도로 채용되고 있습니다.
기술별로는 부르동 튜브, 다이어프램, 캡슐, 앱솔루트, 압전계 및 벨로우즈, 마노미터, 차압계 등으로 분류됩니다. 부르동 튜브 압력계 부문이 약 5억 2,000만 달러의 수익으로 시장을 선도하고, 예측 기간 중 CAGR은 약 4%를 나타낼 것으로 예측됩니다. 견고한 설계와 가혹한 동작 조건을 견딜 수 있는 능력에 의해 계속 지지되고 있습니다. 그 기계적 구조에 의해 가혹한 환경에서도 신뢰성이 높은 성능을 발휘할 수 있기 때문에 폭넓은 산업용도에 적합합니다.
제품 유형에 따라 세계 시장은 아날로그와 디지털로 나뉩니다. 아날로그 게이지는 2024년 시장 점유율의 약 61.4%를 차지했으며, 2034년까지 연평균 복합 성장률(CAGR)은 3.5%를 나타낼 것으로 예측됩니다. 디지털 게이지는 스마트 시스템과의 정확성과 호환성을 바탕으로 지지를 받고 있으며, CAGR 4.1%를 나타내 아날로그 게이지는 기계적 신뢰성, 비용 효율성 및 전자 부품의 추가 비용 없이 대규모 배포를 필요로 하는 산업에서 광범위한 응용 분야에서 계속 우위를 차지하고 있습니다. 심플한 설계로 내구성이 우수하므로, 저렴한 가격과 업무 효율을 중시하는 산업에 이상적입니다.
미국은 북미의 압력계 시장을 선도하고, 2024년 평가액은 3억 1,000만 달러에 달했으며 2025년부터 2034년까지의 CAGR은 3.9% 이상을 나타낼 것으로 예측되고 있습니다. 이 나라의 강력한 산업 기반과 노후화된 인프라를 업그레이드하는 지속적인 요구가이 성장의 주요 요인이 되었습니다. 압력 측정 시스템은 에너지, 제조, 수처리 및 기타 주요 분야의 응용 분야에서 여전히 중요합니다. 기계식 압력계는 특히 산업계가 까다로운 안전 및 성능 기준을 충족하는 신뢰할 수 있는 솔루션을 찾는 동안 신뢰할 수 있는 성능과 비용 이점으로 인해 널리 사용되고 있습니다.
압력계 시장은 매우 세분화되어 있으며, 많은 기업이 다양한 제품을 제공합니다. 기업은 또한 신흥 시장에서 보다 큰 점유율을 획득하기 위해 제품의 혁신과 지리적 확대에 주력하고 있습니다.
목차
제1장 조사 방법과 범위
제2장 주요 요약
제3장 업계 인사이트
- 생태계 분석
- 밸류체인에 영향을 주는 요인
- 이익률 분석
- 파괴적 혁신
- 향후 전망
- 제조업체
- 유통업체
- 트럼프 정권의 관세 분석
- 무역에 미치는 영향
- 무역량의 혼란
- 보복 조치
- 업계에 미치는 영향
- 공급측의 영향(원재료)
- 주요 원재료의 가격 변동
- 공급망 재구성
- 생산 비용에 미치는 영향
- 수요측의 영향(판매가격)
- 최종 시장에의 가격 전달
- 시장 점유율 동향
- 소비자의 반응 패턴
- 영향을 받는 주요 기업
- 전략적인 업계 대응
- 공급망 재구성
- 가격 설정 및 제품 전략
- 정책관여
- 전망과 향후 검토 사항
- 무역에 미치는 영향
- 공급자의 상황
- 이익률 분석
- 주요 뉴스와 대처
- 규제 상황
- 영향요인
- 성장 촉진요인
- 산업화와 제조업의 성장
- 산업 용도에 있어서의 자동화와 IoT 수요 증가
- 압력 센싱 기술의 기술적 진보
- 업계의 잠재적 위험 및 과제
- 프리미엄 모델의 높은 초기 비용
- 규제상의 과제
- 성장 촉진요인
- 성장 가능성 분석
- Porter's Five Forces 분석
- PESTEL 분석
제4장 경쟁 구도
- 서론
- 기업의 시장 점유율 분석
- 경쟁 포지셔닝 매트릭스
- 전략적 전망 매트릭스
제5장 시장 추계·예측 : 제품 유형별(2021-2034년)
- 주요 동향
- 아날로그 압력계
- 디지털 압력계
제6장 시장 추계·예측 : 기술별(2021-2034년)
- 주요 동향
- 부르동 튜브 압력계
- 다이어프램 압력계
- 캡슐 압력계
- 절대 압력계
- 압전계 압력계
- 기타(벨로우즈, 마노미터, 차동 장치)
제7장 시장 추계·예측 : 재료별(2021-2034년)
- 주요 동향
- 스테인레스 스틸
- 황동
- 알루미늄
- 플라스틱
- 기타(강철, 구리, 청동 등)
제8장 시장 추계·예측 : 최종 용도별(2021-2034년)
- 주요 동향
- 화학 및 석유화학
- 석유 및 가스
- 에너지 및 전력
- 제약
- 물 및 폐수 처리
- 기타(항공우주, 자동차 등)
제9장 시장 추계·예측 : 유통 채널별(2021-2034년)
- 주요 동향
- 온라인
- 오프라인
제10장 시장 추계·예측 : 지역별(2021-2034년)
- 주요 동향
- 북미
- 미국
- 캐나다
- 유럽
- 영국
- 독일
- 프랑스
- 이탈리아
- 스페인
- 러시아
- 아시아태평양
- 중국
- 인도
- 일본
- 한국
- 호주
- 인도네시아
- 말레이시아
- 라틴아메리카
- 브라질
- 멕시코
- 중동 및 아프리카
- 아랍에미리트(UAE)
- 사우디아라비아
- 남아프리카
제11장 기업 프로파일
- Ametek
- Badotherm
- Circor
- Dwyer
- Emerson
- Fluke Corporation
- Honeywell International
- Kobold Instruments
- Newbow
- Omega Engineering
- QED Aerospace
- Wika Instruments
- Winters Instruments
The Global Pressure Gauges Market was valued at USD 1.48 billion in 2024 and is estimated to grow at a CAGR of 3.8% to reach USD 2.12 billion by 2034. The growing demand for pressure measurement devices is largely driven by the accelerating development in industrial sectors such as oil and gas, chemical production, power generation, and automotive manufacturing. These sectors rely on consistent and accurate monitoring of pressure within equipment and systems to ensure operational safety, efficiency, and regulatory compliance. As industries continue to automate their operations, the need for reliable and integrated pressure monitoring solutions becomes even more critical. The technological infrastructure supporting these sectors is evolving rapidly, increasing reliance on automation tools, including pressure gauges, to maintain process integrity and reduce risks associated with equipment failure.

Manufacturing facilities, refineries, and other industrial environments are placing heightened emphasis on operational efficiency and machinery protection. Pressure gauges play a pivotal role in maintaining these standards by preventing over-pressurization, which can lead to significant downtime or costly damage. In emerging economies, especially in Asia-Pacific and Latin America, the demand is further intensified by the growing industrial activity. Nations with expanding industrial bases are turning into major consumers of heavy machinery and refinery operations, driving a corresponding increase in the need for advanced pressure monitoring solutions.
| Market Scope | |
|---|---|
| Start Year | 2024 |
| Forecast Year | 2025-2034 |
| Start Value | $1.48 Billion |
| Forecast Value | $2.12 Billion |
| CAGR | 3.8% |
The advancement of Industry 4.0 has transformed the pressure gauges market with the growing integration of smart technologies. Pressure gauges that are IoT-enabled now offer features such as real-time data tracking, predictive maintenance, and analytics-based performance insights. These devices are being adopted at a rapid pace, particularly in sectors where accuracy and process optimization are essential. With capabilities that enhance productivity, reduce downtime, and offer automated monitoring from remote locations, smart pressure gauges are becoming indispensable across a broad range of industries that demand high-performance monitoring tools.
By technology, the market is classified into bourdon tube, diaphragm, capsule, absolute, piezometer, and other types such as bellows, manometers, and differential pressure gauges. In 2024, the bourdon tube pressure gauges segment led the market with revenue of approximately USD 520 million and is projected to grow at a CAGR of around 4% during the forecast period. Bourdon tube gauges continue to be favored due to their robust design and ability to withstand extreme operational conditions. Their mechanical construction allows for reliable performance in harsh environments, making them suitable for a wide range of industrial applications. These gauges are valued for their longevity, low maintenance costs, and the ability to function effectively in demanding conditions where electronic alternatives may falter.
Based on product type, the global market is divided into analog and digital pressure gauges. Analog gauges, which include bourdon tube and diaphragm types, held around 61.4% of the market share in 2024 and are expected to register a CAGR of 3.5% through 2034. Although digital gauges are gaining traction due to their precision and compatibility with smart systems, growing at a CAGR of 4.1%, analog gauges continue to dominate because of their mechanical reliability, cost-effectiveness, and widespread application in industries that require large-scale deployment without the added cost of electronic components. Their simple design and durable nature make them ideal for industries focused on affordability and operational efficiency.
The United States led the North American pressure gauges market, reaching a valuation of USD 310 million in 2024 and forecasted to grow at a CAGR of over 3.9% from 2025 to 2034. The country's strong industrial base and the ongoing need to upgrade aging infrastructure are major factors contributing to this growth. Pressure measurement systems remain critical for applications across energy, manufacturing, water treatment, and other key sectors. Mechanical pressure gauges continue to be widely used due to their dependable performance and cost advantages, particularly as industries seek reliable solutions that meet strict safety and performance standards.
The pressure gauges market remains highly fragmented, with numerous players offering a wide variety of products. In cost-sensitive regions, price-based competition is especially intense, placing downward pressure on profit margins. Manufacturers are responding by investing heavily in R&D to create next-generation pressure gauges tailored to the evolving requirements of industrial applications. Companies are also focusing on product innovation and geographic expansion to capture a larger share of emerging markets. The ability to adapt quickly to changing market dynamics and deliver differentiated solutions remains a key factor for growth in this competitive landscape.
Table of Contents
Chapter 1 Methodology & Scope
- 1.1 Market scope & definitions
- 1.2 Base estimates & calculations
- 1.3 Forecast calculations.
- 1.4 Data sources
- 1.4.1 Primary
- 1.4.2 Secondary
- 1.4.2.1 Paid sources
- 1.4.2.2 Public sources
Chapter 2 Executive Summary
- 2.1 Industry synopsis, 2021-2034
Chapter 3 Industry Insights
- 3.1 Industry ecosystem analysis
- 3.1.1 Factor affecting the value chain.
- 3.1.2 Profit margin analysis.
- 3.1.3 Disruptions
- 3.1.4 Future outlook
- 3.1.5 Manufacturers
- 3.1.6 Distributors
- 3.2 Trump administration tariffs analysis
- 3.2.1 Impact on trade
- 3.2.1.1 Trade volume disruptions
- 3.2.1.2 Retaliatory measures
- 3.2.2 Impact on the industry
- 3.2.2.1 Supply-side impact (raw materials)
- 3.2.2.2 Price volatility in key materials
- 3.2.2.3 Supply chain restructuring
- 3.2.2.4 Production cost implications
- 3.2.2.5 Demand-side impact (selling price)
- 3.2.2.6 Price transmission to end markets
- 3.2.2.7 Market share dynamics
- 3.2.2.8 Consumer response patterns
- 3.2.3 Key companies impacted
- 3.2.4 Strategic industry responses
- 3.2.4.1 Supply chain reconfiguration
- 3.2.4.2 Pricing and product strategies
- 3.2.4.3 Policy engagement
- 3.2.5 Outlook and future considerations
- 3.2.1 Impact on trade
- 3.3 Supplier landscape
- 3.4 Profit margin analysis.
- 3.5 Key news & initiatives
- 3.6 Regulatory landscape
- 3.7 Impact forces
- 3.7.1 Growth drivers
- 3.7.1.1 Industrialization and manufacturing growth
- 3.7.1.2 Rising demand for automation and IoT in industrial applications
- 3.7.1.3 Technological advancements in pressure sensing technology
- 3.7.2 Industry pitfalls & challenges
- 3.7.2.1 High initial cost of premium models
- 3.7.2.2 Regulatory challenges
- 3.7.1 Growth drivers
- 3.8 Growth potential analysis
- 3.9 Porter's analysis
- 3.10 PESTEL analysis
Chapter 4 Competitive Landscape, 2024
- 4.1 Introduction
- 4.2 Company market share analysis
- 4.3 Competitive positioning matrix
- 4.4 Strategic outlook matrix
Chapter 5 Market Estimates & Forecast, By Product Type, 2021-2034 (USD Billion) (Thousand Units)
- 5.1 Key trends
- 5.2 Analog pressure gauges
- 5.3 Digital pressure gauges
Chapter 6 Market Estimates & Forecast, By Technology, 2021-2034 (USD Billion) (Thousand Units)
- 6.1 Key trends
- 6.2 Bourdon tube pressure gauges
- 6.3 Diaphragm pressure gauges
- 6.4 Capsule pressure gauges
- 6.5 Absolute pressure gauges
- 6.6 Piezometer pressure gauge
- 6.7 Others (Bellows, manometer, differential)
Chapter 7 Market Estimates & Forecast, By Material, 2021-2034 (USD Billion) (Thousand Units)
- 7.1 Key trends
- 7.2 Stainless steel
- 7.3 Brass
- 7.4 Aluminum
- 7.5 Plastic
- 7.6 Others (steel, copper, bronze etc.)
Chapter 8 Market Estimates & Forecast, By End Use, 2021-2034 (USD Billion) (Thousand Units)
- 8.1 Key trends
- 8.2 Chemical & petrochemical
- 8.3 Oil & gas
- 8.4 Energy & power
- 8.5 Pharmaceutical
- 8.6 Water & wastewater treatment
- 8.7 Others (aerospace, automotive, etc.)
Chapter 9 Market Estimates & Forecast, By Distribution Channel, 2021-2034 (USD Billion) (Thousand Units)
- 9.1 Key trends
- 9.2 Online
- 9.3 Offline
Chapter 10 Market Estimates & Forecast, By Region, 2021-2034 (USD Billion) (Thousand Units)
- 10.1 Key trends
- 10.2 North America
- 10.2.1 U.S.
- 10.2.2 Canada
- 10.3 Europe
- 10.3.1 UK
- 10.3.2 Germany
- 10.3.3 France
- 10.3.4 Italy
- 10.3.5 Spain
- 10.3.6 Russia
- 10.4 Asia Pacific
- 10.4.1 China
- 10.4.2 India
- 10.4.3 Japan
- 10.4.4 South Korea
- 10.4.5 Australia
- 10.4.6 Indonesia
- 10.4.7 Malaysia
- 10.5 Latin America
- 10.5.1 Brazil
- 10.5.2 Mexico
- 10.6 MEA
- 10.6.1 UAE
- 10.6.2 Saudi Arabia
- 10.6.3 South Africa
Chapter 11 Company Profiles
- 11.1 Ametek
- 11.2 Badotherm
- 11.3 Circor
- 11.4 Dwyer
- 11.5 Emerson
- 11.6 Fluke Corporation
- 11.7 Honeywell International
- 11.8 Kobold Instruments
- 11.9 Newbow
- 11.10 Omega Engineering
- 11.11 QED Aerospace
- 11.12 Wika Instruments
- 11.13 Winters Instruments


