|
시장보고서
상품코드
1664824
비응축형 화관식 화학 보일러 시장 기회, 성장 촉진요인, 산업 동향 분석, 예측(2025-2034년)Non-Condensing Fire Tube Chemical Boiler Market Opportunity, Growth Drivers, Industry Trend Analysis, and Forecast 2025 - 2034 |
||||||
세계의 비응축형 화관식 화학 보일러 시장은 2024년에는 9억 8,340만 달러에 달하며, 2024-2034년의 CAGR은 4%로 안정된 성장률이 예측됩니다.
이러한 성장은 청정 에너지 솔루션에 대한 수요 증가와 효율성 향상 및 배출량 최소화에 초점을 맞춘 보일러 기술의 지속적인 발전으로 인해 이루어지고 있습니다. 산업 확대는 급속한 도시화, 주요 지역의 산업 성장, 에너지 인프라 현대화 및 업그레이드에 대한 대규모 투자에 의해 더욱 지원되고 있습니다.

10MMBTU/hr 미만의 비응축형 화관식 화학 보일러 분야는 2034년까지 4억 5,000만 달러에 달할 것으로 예상됩니다. 이 보일러는 소규모 용도에 적합하며, 신뢰할 수 있는 성능과 쉬운 작동을 제공합니다. 화학 공정에서 채택이 증가하는 이유는 고급 응축 시스템에 비해 유지보수가 덜 필요하기 때문입니다. 모니터링 및 운영 효율성을 향상시키는 최신 제어 시스템의 통합과 같은 지속적인 기술 발전도 시장 모멘텀을 가속화하고 있습니다.
| 시장 범위 | |
|---|---|
| 시작연도 | 2024년 |
| 예측연도 | 2025-2034년 |
| 시작 금액 | 9억 8,340만 달러 |
| 예상 금액 | 14억 6,000만 달러 |
| CAGR | 4% |
천연가스 연소 비응축형 화관식 화학 보일러 분야는 2034년까지 연평균 5%의 견고한 성장세를 보일 것으로 예상됩니다. 이러한 성장의 원동력은 청정 연료로의 전환과 에너지 수요 증가에 기인합니다. 천연가스의 비용 효율성과 에너지 효율성, 친환경 솔루션 채택에 대한 규제 압력이 이 시장 부문의 원동력이 되고 있습니다. 또한 지속적인 산업 공정에서 신뢰할 수 있는 성능에 대한 수요 증가와 기존 보일러 시스템을 업그레이드하기 위한 지속적인 노력은 이 부문의 성장을 더욱 가속화하고 있습니다.
미국에서는 2034년까지 비응축형 화관식 화학 보일러 시장이 1억 4,000만 달러에 달할 것으로 예상됩니다. 주요 성장 촉진요인으로는 정부 인센티브, 산업용 난방 기술의 최첨단 발전, 인프라 현대화 등이 있습니다. 연소 및 열교환기 설계의 혁신은 연방 및 주 정부의 리베이트 프로그램에 의해 지원되어 이러한 시스템의 채택을 촉진하고 있습니다. 또한 효율을 높이고 비용을 크게 절감하며 엄격한 환경 규제를 준수할 수 있는 능력은 다양한 산업 분야에서 수요를 촉진하고 있습니다.
목차
제1장 조사 방법과 조사 범위
- 시장 범위와 정의
- 시장 추산·예측 파라미터
- 예측 계산
- 데이터 소스
- 1차
- 2차
- 유료
- 공적
제2장 개요
제3장 업계 인사이트
- 업계 에코시스템 분석
- 규제 상황
- 업계에 대한 영향요인
- 성장 촉진요인
- 업계의 잠재적 리스크·과제
- 성장 가능성 분석
- Porter의 산업 분석
- 공급 기업의 교섭력
- 바이어의 교섭력
- 신규 진출업체의 위협
- 대체품의 위협
- PESTEL 분석
제4장 경쟁 구도
- 서론
- 전략적 전망
- 혁신과 지속가능성 전망
제5장 시장 규모·예측 : 용량별, 2021-2034년
- 주요 동향
- 10 MMBTU/hr 이하
- 10-25 MMBTU/hr
- 25-50 MMBTU/hr
- 50-75 MMBTU/hr
- 75-100 MMBTU/h
- 100-175 MMBTU/h
- 175-250 MMBTU/h
- 250 MMBTU/hr 이상
제6장 시장 규모·예측 : 연료별, 2021-2034년
- 주요 동향
- 천연가스
- 석유
- 석탄
- 기타
제7장 시장 규모·예측 : 지역별, 2021-2034년
- 주요 동향
- 북미
- 미국
- 캐나다
- 멕시코
- 유럽
- 영국
- 프랑스
- 독일
- 이탈리아
- 러시아
- 스페인
- 아시아태평양
- 중국
- 호주
- 인도
- 일본
- 한국
- 중동 및 아프리카
- 사우디아라비아
- 아랍에미리트
- 터키
- 남아프리카공화국
- 이집트
- 라틴아메리카
- 브라질
- 아르헨티나
제8장 기업 개요
- Alfa Laval
- Ariston Holding
- Babcock &Wilcox
- Babcock Wanson
- Bosch Industriekessel
- Clayton Industries
- Cleaver-Brooks
- Cochran
- Forbes Marshall
- Fulton
- Hoval
- Hurst Boiler &Welding
- Miura America
- Rakiro
- Rentech Boiler Systems
- Thermax
- Thermodyne Boilers
- Viessmann
The Global Market for non-condensing fire tube chemical boilers is projected to reach USD 983.4 million in 2024, with a steady growth rate of 4% CAGR from 2024 to 2034. This growth is driven by the growing demand for cleaner energy solutions and continuous advancements in boiler technology, focused on boosting efficiency and minimizing emissions. The industry expansion is further supported by rapid urbanization, industrial growth in key regions, and significant investments in modernizing and upgrading energy infrastructure.
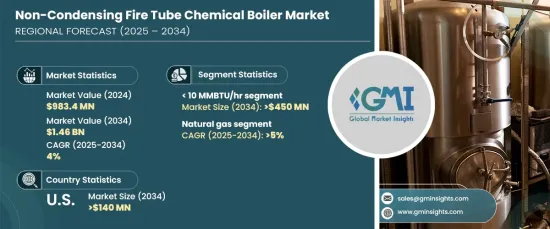
The segment for non-condensing fire tube chemical boilers with a capacity of less than 10 MMBTU/hr is expected to hit USD 450 million by 2034. These boilers are ideal for small-scale applications, offering reliable performance and simple operation. Their growing adoption in chemical processing is attributed to their reduced maintenance needs when compared to more advanced condensing systems. Ongoing technological advancements, including the integration of modern control systems to enhance monitoring and operational efficiency, are also driving the positive momentum in the market.
| Market Scope | |
|---|---|
| Start Year | 2024 |
| Forecast Year | 2025-2034 |
| Start Value | $983.4 Million |
| Forecast Value | $1.46 Billion |
| CAGR | 4% |
The natural gas-fired non-condensing fire tube chemical boilers segment is projected to grow at a robust 5% CAGR through 2034. This growth is fueled by the global transition towards cleaner fuel sources and the increasing demand for energy. Regulatory pressures to adopt environmentally friendly solutions, along with the cost-effectiveness and energy efficiency of natural gas, are helping to propel this market segment forward. Additionally, the rising demand for reliable performance in continuous industrial processes and the ongoing efforts to upgrade existing boiler systems are further accelerating the growth of this segment.
In the U.S., the non-condensing fire tube chemical boiler market is expected to generate USD 140 million by 2034. Key growth drivers include government incentives, cutting-edge advancements in industrial heating technologies, and infrastructure modernization. Innovations in combustion and heat exchanger designs, supported by federal and state rebate programs, are boosting the adoption of these systems. Moreover, their ability to deliver enhanced efficiency, significant cost savings, and ensure compliance with strict environmental regulations is fueling demand across various industries.
Table of Contents
Chapter 1 Methodology & Scope
- 1.1 Market scope & definitions
- 1.2 Market estimates & forecast parameters
- 1.3 Forecast calculation
- 1.4 Data sources
- 1.4.1 Primary
- 1.4.2 Secondary
- 1.4.2.1 Paid
- 1.4.2.2 Public
Chapter 2 Executive Summary
- 2.1 Industry synopsis, 2021 - 2034
Chapter 3 Industry Insights
- 3.1 Industry ecosystem analysis
- 3.2 Regulatory landscape
- 3.3 Industry impact forces
- 3.3.1 Growth drivers
- 3.3.2 Industry pitfalls & challenges
- 3.4 Growth potential analysis
- 3.5 Porter's analysis
- 3.5.1 Bargaining power of suppliers
- 3.5.2 Bargaining power of buyers
- 3.5.3 Threat of new entrants
- 3.5.4 Threat of substitutes
- 3.6 PESTEL analysis
Chapter 4 Competitive Landscape, 2024
- 4.1 Introduction
- 4.2 Strategic outlook
- 4.3 Innovation & sustainability landscape
Chapter 5 Market Size and Forecast, By Capacity, 2021 - 2034 (USD Million, MMBTU/hr & Units)
- 5.1 Key trends
- 5.2 < 10 MMBTU/hr
- 5.3 10 - 25 MMBTU/hr
- 5.4 25 - 50 MMBTU/hr
- 5.5 50 - 75 MMBTU/hr
- 5.6 75 - 100 MMBTU/hr
- 5.7 100 - 175 MMBTU/hr
- 5.8 175 - 250 MMBTU/hr
- 5.9 > 250 MMBTU/hr
Chapter 6 Market Size and Forecast, By Fuel, 2021 - 2034 (USD Million, MMBTU/hr & Units)
- 6.1 Key trends
- 6.2 Natural gas
- 6.3 Oil
- 6.4 Coal
- 6.5 Others
Chapter 7 Market Size and Forecast, By Region, 2021 - 2034 (USD Million, MMBTU/hr & Units)
- 7.1 Key trends
- 7.2 North America
- 7.2.1 U.S.
- 7.2.2 Canada
- 7.2.3 Mexico
- 7.3 Europe
- 7.3.1 UK
- 7.3.2 France
- 7.3.3 Germany
- 7.3.4 Italy
- 7.3.5 Russia
- 7.3.6 Spain
- 7.4 Asia Pacific
- 7.4.1 China
- 7.4.2 Australia
- 7.4.3 India
- 7.4.4 Japan
- 7.4.5 South Korea
- 7.5 Middle East & Africa
- 7.5.1 Saudi Arabia
- 7.5.2 UAE
- 7.5.3 Turkey
- 7.5.4 South Africa
- 7.5.5 Egypt
- 7.6 Latin America
- 7.6.1 Brazil
- 7.6.2 Argentina
Chapter 8 Company Profiles
- 8.1 Alfa Laval
- 8.2 Ariston Holding
- 8.3 Babcock & Wilcox
- 8.4 Babcock Wanson
- 8.5 Bosch Industriekessel
- 8.6 Clayton Industries
- 8.7 Cleaver-Brooks
- 8.8 Cochran
- 8.9 Forbes Marshall
- 8.10 Fulton
- 8.11 Hoval
- 8.12 Hurst Boiler & Welding
- 8.13 Miura America
- 8.14 Rakiro
- 8.15 Rentech Boiler Systems
- 8.16 Thermax
- 8.17 Thermodyne Boilers
- 8.18 Viessmann