|
시장보고서
상품코드
1665083
스마트 나노 건축자재 시장 기회, 성장 촉진 요인, 산업 동향 분석, 예측(2024-2032년)Smart Nano-Construction Materials Market Opportunity, Growth Drivers, Industry Trend Analysis, and Forecast 2024 - 2032 |
||||||
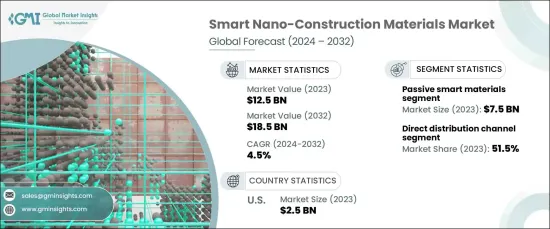
세계의 스마트 나노 건축자재 시장은 2023년에 125억 달러에 달했으며 2024년부터 2032년까지 연평균 복합 성장률(CAGR) 4.5%로 성장할 것으로 예상됩니다.
이 성장의 주요 요인은 나노기술의 급속한 진보로 우수한 특성을 가진 재료가 개발되었다는 것입니다. 이러한 혁신은 자체 복구 능력, 내구성 향상, 단열성 향상 등의 이점을 제공하며, 이 모든 것이 건설 프로젝트의 수명과 성능을 향상시킵니다. 이러한 재료가 보다 정교해짐에 따라 건축 기준을 향상시킬 뿐만 아니라 에너지 효율이 높고 환경적으로 지속 가능한 건설 솔루션에 대한 수요 증가에도 대응할 수 있습니다. 이 변화는 세계의 지속가능성 목표를 따르고, 이러한 첨단 재료는 에너지 소비를 줄이고 현대적인 건물의 환경 발자국을 줄이는 데 도움이 되기 때문입니다.

그린 에너지 효율적인 건물에 대한 수요가 스마트 나노 건설 재료의 채용을 가속화하고 있습니다. 이러한 재료는 건물의 에너지 효율과 구조적 무결성을 향상시킬 수 있기 때문에 점점 더 선호되고 있으며 에너지 비용과 배출량을 크게 줄일 수 있습니다. 스마트 나노 건축자재는 건축물의 내구성과 기능성을 장기간 유지하면서 지속가능성 목표를 달성하는데 도움을 주며 건설 업계의 미래를 형성하는데 중요한 역할을 하고 있습니다.
| 시장 범위 | |
|---|---|
| 시작 연도 | 2023 |
| 예측 연도 | 2024-2032 |
| 시작 금액 | 125억 달러 |
| 예측 금액 | 185억 달러 |
| CAGR | 4.5% |
재료 유형의 경우 시장은 활성 스마트 재료와 수동 스마트 재료의 두 가지 주요 부문으로 나뉩니다. 2023년에는 패시브 스마트 소재가 75억 달러 시장 규모를 차지했습니다. 이 부문은 예측 기간을 통해 CAGR 4.2%로 확대될 것으로 예측됩니다. 자가 복구 콘크리트 및 단열 나노 복합체와 같은 수동 스마트 재료는 외부 제어 시스템 없이도 자율적으로 건물의 성능을 향상시킵니다.
이러한 재료의 유통 채널도 진화하고 있어 직접 유통 방식을 선호하는 경향이 현저합니다. 2023년에는 직접 유통 채널이 시장의 51.5% 점유율을 차지했고 2024년부터 2032년까지의 CAGR은 4.6%의 성장률을 기록할 것으로 예상됩니다.직접 유통을 통해 제조업체는 최종 사용자와 직접적인 연결을 수립하여 비용 절감과 고객 서비스 향상에 기여합니다. 또한 특수 제품을 신속하게 시장에 전달할 수 있기 때문에 전체 시장으로의 도달과 침투가 촉진됩니다.
2023년 25억 달러로 평가된 미국의 스마트 나노 건축자재 시장은 2024년부터 2032년까지 연평균 복합 성장률(CAGR) 4.6%로 성장할 것으로 예측됩니다. 지속 가능한 인프라에 대한 많은 투자, 첨단 건설 기술, 에너지 효율적인 재료에 대한 주력 등의 요인이 이러한 성장을 뒷받침하고 있습니다. 그린 빌딩 실천을 지원하는 정부 이니셔티브는 미국에서 스마트 나노 건설 재료의 채택을 더욱 추진하고 지속 가능하고 내구성있는 빌딩의 창조에 대한 국가의 헌신을 강화하고 있습니다.
목차
제1장 조사 방법과 조사 범위
- 시장 범위와 정의
- 기본 추정과 계산
- 예측 파라미터
- 데이터 소스
- 1차 데이터
- 2차 데이터
- 유료 정보원
- 공적 정보원
제2장 주요 요약
제3장 업계 인사이트
- 생태계 분석
- 밸류체인에 영향을 주는 요인
- 이익률 분석
- 파괴
- 장래의 전망
- 제조업체
- 유통업체
- 공급자의 상황
- 이익률 분석
- 주요 뉴스
- 규제 상황
- 기술적 전망
- 영향요인
- 성장 촉진요인
- 나노기술의 진보
- 그린빌딩에 대한 수요 증가
- 인프라 개발 증가
- 재료 성능과 내구성 향상
- 업계의 잠재적 위험 및 과제
- 높은 제조 비용
- 인지도와 채용이 한정적
- 성장 촉진요인
- 성장 가능성 분석
- Porter's Five Forces 분석
- PESTEL 분석
제4장 경쟁 구도
- 소개
- 기업 점유율 분석
- 경쟁 포지셔닝 매트릭스
- 전략 전망 매트릭스
제5장 시장 추정 및 예측 : 소재 유형별, 2021년-2032년
- 주요 동향
- 스마트 나노콘크리트
- 스마트 나노 코팅
- 스마트 나노 유리
- 기타(나노 단열재, 첨가제 등)
제6장 시장 추정 및 예측 : 기술 유형별, 2021년-2032년
- 주요 동향
- 액티브 및 스마트 재료
- 패시브 및 스마트 재료
제7장 시장 추정 및 예측 : 용도별, 2021년-2032년
- 주요 동향
- 구조용도
- 비구조 용도
- 모니터링 시스템
제8장 시장 추정 및 예측 : 최종 용도별, 2021년-2032년
- 주요 동향
- 상업 빌딩
- 주택
- 인프라
- 산업용
제9장 시장 추정 및 예측 : 유통 채널별, 2021년-2032년
- 주요 동향
- 직접 유통
- 간접 유통
제10장 시장 추정 및 예측 : 지역별, 2021년-2032년
- 주요 동향
- 북미
- 미국
- 캐나다
- 유럽
- 영국
- 독일
- 프랑스
- 이탈리아
- 스페인
- 아시아태평양
- 중국
- 일본
- 인도
- 호주
- 라틴아메리카
- 브라질
- 멕시코
- 중동 및 아프리카
- 남아프리카
- 사우디아라비아
- 아랍에미리트(UAE)
제11장 기업 프로파일
- 3M Company
- Advenira Enterprises, Inc.
- Aerogel Technologies, LLC
- AkzoNobel NV
- Arkema
- BASF SE
- Cabot Corporation
- Dupont
- Evonik Industries AG
- Haliburton Company
- Nanogate SE
- Nanophase Technologies Corporation
- NanoPore Incorporated
- Saint-Gobain
- XG Sciences, Inc.
The Global Smart Nano-Construction Materials Market reached a valuation of USD 12.5 billion in 2023 and is expected to grow at a CAGR of 4.5% from 2024 to 2032. This growth is primarily driven by rapid advancements in nanotechnology, which have led to the development of materials with exceptional properties. These innovations offer benefits like self-healing capabilities, enhanced durability, and better thermal insulation, all of which improve the longevity and performance of construction projects. As these materials become more sophisticated, they not only elevate building standards but also cater to the growing demand for energy-efficient and environmentally sustainable construction solutions. This shift aligns with global sustainability goals, as these advanced materials can help reduce energy consumption and lower the environmental footprint of modern buildings.
The demand for green, energy-efficient buildings has accelerated the adoption of smart nano-construction materials. These materials are increasingly favored due to their ability to enhance the energy efficiency and structural integrity of buildings, which contributes to substantial reductions in energy costs and emissions. Smart nano-construction materials play a crucial role in shaping the future of the construction industry, helping to meet sustainability goals while ensuring that buildings remain durable and functional for longer periods.
| Market Scope | |
|---|---|
| Start Year | 2023 |
| Forecast Year | 2024-2032 |
| Start Value | $12.5 Billion |
| Forecast Value | $18.5 Billion |
| CAGR | 4.5% |
Regarding material types, the market is divided into two key segments: active and passive smart materials. In 2023, passive smart materials dominated the market, holding a value of USD 7.5 billion. This segment is projected to expand at a CAGR of 4.2% through the forecast period. Passive smart materials, such as self-healing concrete and thermal insulation nanocomposites, autonomously enhance the performance of buildings without the need for external control systems.
The distribution channels for these materials are also evolving, with a notable preference for direct distribution methods. In 2023, the direct distribution channel held a 51.5% share of the market and is anticipated to grow at a CAGR of 4.6% from 2024 to 2032. Direct distribution allows manufacturers to establish a direct connection with end-users, helping to reduce costs and improve customer service. Additionally, it ensures that specialized products reach the market promptly, which boosts overall market reach and penetration.
The U.S. market for smart nano-construction materials, valued at USD 2.5 billion in 2023, is projected to grow at a CAGR of 4.6% from 2024 to 2032. Factors such as substantial investments in sustainable infrastructure, advanced construction technologies, and a focus on energy-efficient materials are driving this growth. Government initiatives supporting green building practices further propel the adoption of smart nano-construction materials in the U.S., reinforcing the nation's commitment to creating sustainable and durable buildings.
Table of Contents
Chapter 1 Methodology & Scope
- 1.1 Market scope & definition
- 1.2 Base estimates & calculations
- 1.3 Forecast parameters
- 1.4 Data sources
- 1.4.1 Primary
- 1.5 Secondary
- 1.5.1.1 Paid sources
- 1.5.1.2 Public sources
Chapter 2 Executive Summary
- 2.1 Industry synopsis, 2021 - 2032
Chapter 3 Industry Insights
- 3.1 Industry ecosystem analysis
- 3.1.1 Factor affecting the value chain
- 3.1.2 Profit margin analysis
- 3.1.3 Disruptions
- 3.1.4 Future outlook
- 3.1.5 Manufacturers
- 3.1.6 Distributors
- 3.2 Supplier landscape
- 3.3 Profit margin analysis
- 3.4 Key news & initiatives
- 3.5 Regulatory landscape
- 3.6 Technological landscape
- 3.7 Impact forces
- 3.7.1 Growth drivers
- 3.7.1.1 Advancements in nanotechnology
- 3.7.1.2 Rising demand for green buildings
- 3.7.1.3 Increased infrastructure development
- 3.7.1.4 Enhanced material performance and durability
- 3.7.2 Industry pitfalls & challenges
- 3.7.2.1 High production costs
- 3.7.2.2 Limited awareness and adoption
- 3.7.1 Growth drivers
- 3.8 Growth potential analysis
- 3.9 Porter’s analysis
- 3.10 PESTEL analysis
Chapter 4 Competitive Landscape, 2023
- 4.1 Introduction
- 4.2 Company market share analysis
- 4.3 Competitive positioning matrix
- 4.4 Strategic outlook matrix
Chapter 5 Market Estimates and Forecast, By Material Type, 2021 – 2032 (USD Billion) (Tons)
- 5.1 Key trends
- 5.2 Smart nano concrete
- 5.3 Smart nano coatings
- 5.4 Smart nano glass
- 5.5 Others (nano-insulation materials, additives, etc.)
Chapter 6 Market Estimates and Forecast, By Technology Type, 2021 – 2032 (USD Billion) (Tons)
- 6.1 Key trends
- 6.2 Active smart materials
- 6.3 Passive smart materials
Chapter 7 Market Estimates and Forecast, By Application, 2021 – 2032 (USD Billion) (Tons)
- 7.1 Key trends
- 7.2 Structural applications
- 7.3 Non-structural applications
- 7.4 Monitoring systems
Chapter 8 Market Estimates and Forecast, By End Use, 2021 – 2032 (USD Billion) (Tons)
- 8.1 Key trends
- 8.2 Commercial buildings
- 8.3 Residential buildings
- 8.4 Infrastructure
- 8.5 Industrial
Chapter 9 Market Estimates & Forecast, By Distribution Channel, 2021 – 2032, (USD Billion) (Tons)
- 9.1 Key trends
- 9.2 Direct
- 9.3 Indirect
Chapter 10 Market Estimates & Forecast, By Region, 2021 – 2032, (USD Billion) (Tons)
- 10.1 Key trends
- 10.2 North America
- 10.2.1 U.S.
- 10.2.2 Canada
- 10.3 Europe
- 10.3.1 UK
- 10.3.2 Germany
- 10.3.3 France
- 10.3.4 Italy
- 10.3.5 Spain
- 10.4 Asia Pacific
- 10.4.1 China
- 10.4.2 Japan
- 10.4.3 India
- 10.4.4 Australia
- 10.5 Latin America
- 10.5.1 Brazil
- 10.5.2 Mexico
- 10.6 MEA
- 10.6.1 South Africa
- 10.6.2 Saudi Arabia
- 10.6.3 UAE
Chapter 11 Company Profiles (Business Overview, Financial Data, Product Landscape, Strategic Outlook, SWOT Analysis)
- 11.1 3M Company
- 11.2 Advenira Enterprises, Inc.
- 11.3 Aerogel Technologies, LLC
- 11.4 AkzoNobel N.V.
- 11.5 Arkema
- 11.6 BASF SE
- 11.7 Cabot Corporation
- 11.8 Dupont
- 11.9 Evonik Industries AG
- 11.10 Haliburton Company
- 11.11 Nanogate SE
- 11.12 Nanophase Technologies Corporation
- 11.13 NanoPore Incorporated
- 11.14 Saint-Gobain
- 11.15 XG Sciences, Inc.