|
시장보고서
상품코드
1665244
첨단 교통요금 시스템 시장 : 기회, 성장 촉진요인, 산업 동향 분석, 예측(2025-2034년)Advanced Transportation Pricing System (ATPS) Market Opportunity, Growth Drivers, Industry Trend Analysis, and Forecast 2025 - 2034 |
||||||
세계의 첨단 교통요금 시스템 시장은 2024년 49억 달러였으며 2025-2034년까지 CAGR 7.6%로 예측되어 강력한 성장궤도를 그릴 것으로 보입니다.
이 역동적인 시장 확대의 배경은 급속한 도시화, 교통 정체의 심각화, 지능형 교통 관리 솔루션에 대한 임박한 요구를 포함합니다. 세계 각국의 정부는 이산화탄소 배출을 억제하고 도로 효율을 높이기 위해 지속 가능한 교통 시책을 채택하여 혁신적인 가격 설정 시스템에 대한 수요를 더욱 촉진하고 있습니다. IoT, AI, 데이터 분석의 통합은 ATPS 시장에 혁명을 일으켰고, 병목 현상과 지연을 크게 줄이면서 도로 이용을 최적화하는 실시간 모니터링과 동적 가격 모델을 강화했습니다. 이러한 진보는 세계의 교통망을 근대화하고 스마트 시티의 목표에 합치시키는 데 이 시장이 매우 중요한 역할을 담당하고 있다는 것을 뒷받침하고 있습니다.
이 시장의 주요 촉진요인 중 하나는 전자 수수료 징수(ETC) 시스템의 채택이 확대되고 있다는 것입니다. 이러한 첨단 시스템은 자동 결제를 촉진하고 수동 수수료 징수 작업으로 인한 지연을 없애고 전반적인 운송 효율을 높입니다. 수익 회수를 간소화함으로써 ETC 시스템은 인프라 현대화 노력에 기여하여 사용자의 편의성을 향상시키고 있습니다. 정부와 민간 단체가 운송 틀의 업그레이드를 선호하는 가운데 ETC 시스템의 도입은 기세를 늘리고 있습니다.
| 시장 범위 | |
|---|---|
| 시작 연도 | 2024년 |
| 예측 연도 | 2025-2034년 |
| 시작 금액 | 49억 달러 |
| 예측 금액 | 101억 달러 |
| CAGR | 7.6% |
시장은 솔루션에 의해 구분되며, 정체 요금 설정, 주행 거리(VMT), 전자 요금 징수(ETC)가 주도권을 잡고 있습니다. 2024년에는 정체 요금 설정이 39%의 압도적인 시장 점유율을 차지했고 2034년에는 40억 달러 이상에 달할 것으로 예상됩니다. 교통 수요와 상황에 따라 요금을 조정하는 이 접근법은 교통 체증을 효과적으로 완화하고, 공공 운송의 이용을 촉진하며, 환경 친화적인 여행 옵션을 지원합니다. 정체 요금 설정에서 얻은 수익은 인프라 정비에 재투자되는 경우가 많으며, 스마트 시티의 생태계와 지속 가능한 도시 모빌리티 이니셔티브가 필요합니다.
클라우드 기반 및 온프레미스 시스템에는 각각 명확한 이점이 있습니다. 클라우드 기반 솔루션은 확장성, 비용 효율성 및 실시간 데이터를 원활하게 처리할 수 있어 2024년 시장 점유율이 66%로 크게 확대되었습니다. 이러한 솔루션은 첨단 분석을 가능하게 하고, 시스템 유지보수를 간소화하고, 도시가 운영을 확장하거나 기존 시스템과 통합할 수 있는 유연성을 설명합니다. 그 적응성은 특히 급속하게 진화하는 도시 환경에서 최신 교통 요금 프레임 워크의 바람직한 선택으로 자리 잡고 있습니다.
2024년 첨단 교통요금 시스템 시장은 북미가 세계 점유율의 35%를 차지했고 2034년까지 30억 달러를 창출할 것으로 예측됩니다. 이 지역에서는 VMT와 교통 체증 가격을 포함한 동적 가격 모델에 대한 관심이 높아지고 있으며, 중요한 교통 관리 문제와 인프라 자금 부족에 대처하고 있습니다. 북미에서는 AI와 IoT 기술의 도입이 진행되어 실시간 데이터 분석 능력이 강화되어 보다 스마트한 교통관제 시스템이 성장하여 스마트시티 개발이 가속화되고 있습니다.
목차
제1장 조사 방법과 조사 범위
- 조사 디자인
- 조사 접근
- 데이터 수집 방법
- 기본 추정과 계산
- 기준연도의 산출
- 시장 추정의 주요 동향
- 예측 모델
- 1차 조사와 검증
- 1차 정보
- 데이터 마이닝 소스
- 시장 정의
제2장 주요 요약
제3장 산업 인사이트
- 생태계 분석
- 공급자의 상황
- 부품 공급자
- 인프라 공급자
- 솔루션 제공업체
- 시스템 통합자
- 정부·공공기관
- 최종 사용자
- 이익률 분석
- 기술과 혁신의 전망
- 특허 분석
- 주요 뉴스 및 이니셔티브
- 규제 상황
- 기술의 차별화 요인
- 실시간 데이터 분석
- IoT와의 통합
- AI에 의한 교통 관리
- 영향요인
- 성장 촉진요인
- 스마트 시티와 모빌리티 솔루션 채용 확대
- 교통 시스템의 관민 파트너십 확대
- 지속 가능한 교통 인프라와 시책을 추진하는 정부의 대처
- 도시 정체 증가에 의한 효율적인 교통 관리 솔루션 수요 증가
- 산업의 잠재적 리스크 및 과제
- 높은 초기 도입 비용과 유지 보수 비용
- 다이나믹 가격 모델에 대한 소비자의 저항
- 성장 촉진요인
- 성장 가능성 분석
- Porter's Five Forces 분석
- PESTEL 분석
제4장 경쟁 구도
- 소개
- 기업 점유율 분석
- 경쟁 포지셔닝 매트릭스
- 전략 전망 매트릭스
제5장 시장 추정·예측 : 솔루션별, 2021-2034년
- 주요 동향
- 정체 요금 설정
- 주행 거리(VMT)
- 전자요금징수(ETC)
- 기타
제6장 시장 추정·예측 : 전개별, 2021-2034년
- 주요 동향
- 클라우드 기반
- 온프레미스
제7장 시장 추정·예측 : 용도별, 2021-2034년
- 주요 동향
- 도시 정체 관리
- 스마트 시티 통합
- 화물 및 물류 가격
- 주차장 관리
제8장 시장 추정·예측 : 최종 용도별, 2021-2034년
- 주요 동향
- 정부 당국
- 비공개회사
- 소비자·차량 소유자
제9장 시장 추정·예측 : 지역별, 2021-2034년
- 주요 동향
- 북미
- 미국
- 캐나다
- 유럽
- 영국
- 독일
- 프랑스
- 스페인
- 이탈리아
- 러시아
- 북유럽
- 아시아태평양
- 중국
- 인도
- 일본
- 한국
- 뉴질랜드
- 동남아시아
- 라틴아메리카
- 브라질
- 멕시코
- 아르헨티나
- 중동 및 아프리카
- 아랍에미리트(UAE)
- 남아프리카
- 사우디아라비아
제10장 기업 프로파일
- ACS
- Conduent
- Cubic
- Ericsson
- Fluor
- Hewlett Packard
- IBM
- INIT
- International Road Dynamics
- Iteris
- Kapsch TrafficCom
- Mobiliya
- Moovit
- Q-Free
- Siemens Mobility
- TollPlus
- TomTom
- TransCore
- Viaplus
- Worldline
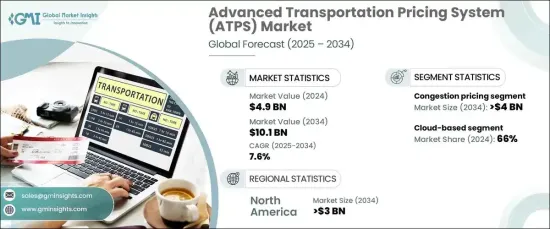
The Global Advanced Transportation Pricing System Market, valued at USD 4.9 billion in 2024, is set to experience a robust growth trajectory with a projected CAGR of 7.6% from 2025 to 2034. This dynamic market expansion is fueled by rapid urbanization, escalating traffic congestion, and the pressing need for intelligent traffic management solutions. Governments worldwide are adopting sustainable transportation policies to curb carbon emissions and enhance road efficiency, further driving the demand for innovative pricing systems. The integration of IoT, AI, and data analytics has revolutionized the ATPS market, empowering real-time monitoring and dynamic pricing models that optimize road usage while significantly reducing bottlenecks and delays. These advancements underscore the market's pivotal role in modernizing global transportation networks and aligning them with smart city goals.

One of the key drivers of this market is the growing adoption of electronic toll collection (ETC) systems. These advanced systems facilitate automated payments, eliminating delays caused by manual tolling operations and enhancing overall transportation efficiency. By streamlining revenue collection, ETC systems contribute to infrastructure modernization efforts and improve the user experience. As governments and private entities prioritize upgrades to transportation frameworks, the deployment of ETC systems continues to gain momentum.
| Market Scope | |
|---|---|
| Start Year | 2024 |
| Forecast Year | 2025-2034 |
| Start Value | $4.9 Billion |
| Forecast Value | $10.1 Billion |
| CAGR | 7.6% |
The market is segmented based on solutions, with congestion pricing, vehicle miles traveled (VMT), and ETC leading the charge. In 2024, congestion pricing dominated the segment with a commanding 39% market share and is expected to exceed USD 4 billion by 2034. This approach, which adjusts charges based on traffic demand and conditions, effectively reduces congestion, encourages the use of public transportation, and supports eco-friendly travel options. Revenue generated from congestion pricing is often reinvested into infrastructure improvements, making it a cornerstone of smart city ecosystems and sustainable urban mobility initiatives.
Deployment type further defines the market, with cloud-based and on-premises systems offering distinct advantages. Cloud-based solutions captured a significant 66% market share in 2024 due to their scalability, cost-efficiency, and ability to process real-time data seamlessly. These solutions enable advanced analytics, simplify system maintenance, and provide flexibility for cities to scale operations or integrate with existing systems. Their adaptability positions them as the preferred choice for modern transportation pricing frameworks, especially in rapidly evolving urban environments.
North America led the advanced transportation pricing system market in 2024, accounting for 35% of the global share, and is projected to generate USD 3 billion by 2034. The region's growing focus on dynamic pricing models, including VMT and congestion pricing, addresses critical traffic management challenges and infrastructure funding gaps. The increasing deployment of AI and IoT technologies in North America enhances real-time data analysis capabilities, fostering smarter traffic control systems and accelerating the development of smart cities.
Table of Contents
Chapter 1 Methodology & Scope
- 1.1 Research design
- 1.1.1 Research approach
- 1.1.2 Data collection methods
- 1.2 Base estimates and calculations
- 1.2.1 Base year calculation
- 1.2.2 Key trends for market estimates
- 1.3 Forecast model
- 1.4 Primary research & validation
- 1.4.1 Primary sources
- 1.4.2 Data mining sources
- 1.5 Market definitions
Chapter 2 Executive Summary
- 2.1 Industry 3600 synopsis, 2021 - 2034
Chapter 3 Industry Insights
- 3.1 Industry ecosystem analysis
- 3.2 Supplier landscape
- 3.2.1 Component suppliers
- 3.2.2 Infrastructure suppliers
- 3.2.3 Solution providers
- 3.2.4 System integrators
- 3.2.5 Government & public sector entities
- 3.2.6 End-users
- 3.3 Profit margin analysis
- 3.4 Technology & innovation landscape
- 3.5 Patent analysis
- 3.6 Key news & initiatives
- 3.7 Regulatory landscape
- 3.8 Technology differentiators
- 3.8.1 Real-time data analytics
- 3.8.2 Integration with IoT
- 3.8.3 AI-powered traffic management
- 3.9 Impact forces
- 3.9.1 Growth drivers
- 3.9.1.1 Increasing adoption of smart city and mobility solutions
- 3.9.1.2 Expansion of public-private partnerships in transportation systems
- 3.9.1.3 Government initiatives promoting sustainable transport infrastructure and policies
- 3.9.1.4 Rising urban congestion demands efficient traffic management solutions
- 3.9.2 Industry pitfalls & challenges
- 3.9.2.1 High initial implementation and maintenance costs
- 3.9.2.2 Resistance from consumers to dynamic pricing models
- 3.9.1 Growth drivers
- 3.10 Growth potential analysis
- 3.11 Porter’s analysis
- 3.12 PESTEL analysis
Chapter 4 Competitive Landscape, 2024
- 4.1 Introduction
- 4.2 Company market share analysis
- 4.3 Competitive positioning matrix
- 4.4 Strategic outlook matrix
Chapter 5 Market Estimates & Forecast, By Solution, 2021 - 2034 ($Bn)
- 5.1 Key trends
- 5.2 Congestion pricing
- 5.3 Vehicle miles traveled (VMT)
- 5.4 Electronic toll collection (ETC)
- 5.5 Others
Chapter 6 Market Estimates & Forecast, By Deployment, 2021 - 2034 ($Bn)
- 6.1 Key trends
- 6.2 Cloud-based
- 6.3 On-premise
Chapter 7 Market Estimates & Forecast, By Application, 2021 - 2034 ($Bn)
- 7.1 Key trends
- 7.2 Urban congestion management
- 7.3 Smart city integration
- 7.4 Freight and logistics pricing
- 7.5 Parking management
Chapter 8 Market Estimates & Forecast, By End Use, 2021 - 2034 ($Bn)
- 8.1 Key trends
- 8.2 Government authorities
- 8.3 Private transportation companies
- 8.4 Consumers and vehicle owners
Chapter 9 Market Estimates & Forecast, By Region, 2021 - 2034 ($Bn)
- 9.1 Key trends
- 9.2 North America
- 9.2.1 U.S.
- 9.2.2 Canada
- 9.3 Europe
- 9.3.1 UK
- 9.3.2 Germany
- 9.3.3 France
- 9.3.4 Spain
- 9.3.5 Italy
- 9.3.6 Russia
- 9.3.7 Nordics
- 9.4 Asia Pacific
- 9.4.1 China
- 9.4.2 India
- 9.4.3 Japan
- 9.4.4 South Korea
- 9.4.5 ANZ
- 9.4.6 Southeast Asia
- 9.5 Latin America
- 9.5.1 Brazil
- 9.5.2 Mexico
- 9.5.3 Argentina
- 9.6 MEA
- 9.6.1 UAE
- 9.6.2 South Africa
- 9.6.3 Saudi Arabia
Chapter 10 Company Profiles
- 10.1 ACS
- 10.2 Conduent
- 10.3 Cubic
- 10.4 Ericsson
- 10.5 Fluor
- 10.6 Hewlett Packard
- 10.7 IBM
- 10.8 INIT
- 10.9 International Road Dynamics
- 10.10 Iteris
- 10.11 Kapsch TrafficCom
- 10.12 Mobiliya
- 10.13 Moovit
- 10.14 Q-Free
- 10.15 Siemens Mobility
- 10.16 TollPlus
- 10.17 TomTom
- 10.18 TransCore
- 10.19 Viaplus
- 10.20 Worldline