
|
시장보고서
상품코드
1665345
자동 시야계 시장 기회, 성장 촉진요인, 산업 동향 분석, 예측(2025-2034년)Automated Visual Field Analyzer Market Opportunity, Growth Drivers, Industry Trend Analysis, and Forecast 2025 - 2034 |
||||||
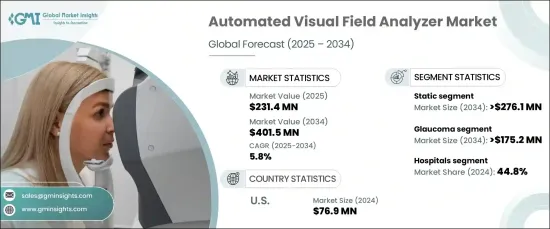
세계의 자동 시야계 시장은 2024년에 2억 3,140만 달러에 달하며, 2025-2034년에 CAGR 5.8%로 성장할 것으로 예측됩니다. 이러한 성장 궤적은 기술 발전, 안과 질환의 유병률 증가, 조기 진단이 시력 유지에 미치는 중요한 역할에 대한 인식이 높아짐에 의해 촉진되고 있습니다. 자동 시야계는 현대 안과 의료에 필수적인 요소로 자리 잡았으며, 시력 장애를 감지하고 모니터링하는 데 놀라울 정도로 정확하게 도움을 주고 있습니다.
기술 혁신, 특히 인공지능과 머신러닝의 통합은 자동 시력 측정기의 효율성과 정확성을 크게 향상시켰습니다. 이러한 발전은 보다 빠르고 정확한 결과를 가능하게 하여 병원 및 전문 안과 클리닉에서 최첨단 진단 툴에 대한 수요 증가에 부응하고 있습니다. 또한 사용자 친화적인 인터페이스와 향상된 검사 기능은 다양한 임상 환경에서 폭넓은 채택을 촉진하고 현대 안과 의료에서 이러한 기기의 역할을 확고히 하고 있습니다.
| 시장 범위 | |
|---|---|
| 시작연도 | 2024년 |
| 예측연도 | 2025-2034년 |
| 시작 금액 | 2억 3,140만 달러 |
| 예상 금액 | 4억 150만 달러 |
| CAGR | 5.8% |
시장은 제품 유형별로 정적 분석기와 동적 분석기로 구분됩니다. 정적 분석기는 꾸준한 성장이 예상되며, CAGR 5.5%로 2034년에는 2억 7,610만 달러에 달할 것으로 예상됩니다. 이 장비들은 환자의 시야내 고정점을 평가하고 시각 장애를 조기에 발견하는 데 필수적인 고정밀하고 재현성 높은 데이터를 제공합니다. 신뢰성과 사용 편의성으로 인해 임상 진단 및 연구용으로 가장 유력한 후보로 떠오르고 있습니다. 특히 전 세계 시력 상실의 주요 원인인 녹내장 유병률 증가는 고령화 사회에서 이 분야의 성장을 더욱 촉진하고 있습니다.
용도별로는 녹내장, 노화성 황반변성(AMD), 신경질환, 기타 용도가 있습니다. 녹내장 부문은 연평균 6.3%의 견고한 성장세를 보이며 2034년까지 1억 7,520만 달러에 달할 것으로 예상됩니다. 당뇨병, 고혈압과 같은 위험 요인으로 인해 녹내장 환자가 증가하고 있으며, 첨단 진단 툴의 필요성이 강조되고 있습니다. 자동 시야계는 녹내장 진행을 감지하고 모니터링하는 데 탁월하여 조기 개입의 기회를 제공하고 돌이킬 수 없는 시력 손실의 위험을 줄일 수 있습니다.
미국 자동시력계 시장은 2024년 7,690만 달러로 평가되었고, 2034년까지 연평균 4.8% 성장할 것으로 예상됩니다. 이러한 성장의 원동력은 녹내장, AMD, 당뇨망막병증과 같은 시각 관련 질환의 유병률 증가에 기인합니다. 이러한 질환의 유병률이 높은 고령화로 인해 정기적인 안과 검사와 첨단 진단 기술의 필요성이 증가하고 있습니다. 지속적인 기술 혁신, 특히 AI와 ML의 채택은 진단의 정확성과 효율성을 지속적으로 향상시키고 있으며, 미국 의료 환경 전반에 걸쳐 이러한 기기의 채택을 촉진하고 있습니다.
목차
제1장 조사 방법과 조사 범위
제2장 개요
제3장 산업 인사이트
- 에코시스템 분석
- 산업에 대한 영향요인
- 촉진요인
- 녹내장과 기타 안질환의 유병률 상승
- 조기진단에 대한 주목의 증가
- 신경학적 평가에 대한 채택
- 외래 안과의료에 대한 수요 증가
- 산업의 잠재적 리스크·과제
- 기기의 고비용
- 촉진요인
- 성장 가능성 분석
- 규제 상황
- 상환 시나리오
- 기술
- 갭 분석
- Porter의 산업 분석
- PESTEL 분석
- 향후 시장 동향
제4장 경쟁 구도
- 서론
- 기업 매트릭스 분석
- 기업 점유율 분석
- 주요 시장 기업의 경쟁 분석
- 경쟁 포지셔닝 매트릭스
- 전략 대시보드
제5장 시장 추정·예측 : 제품 유형별, 2021-2034년
- 주요 동향
- 정적
- 동적
제6장 시장 추정·예측 : 용도별, 2021-2034년
- 주요 동향
- 녹내장
- 노인황반변성(AMD)
- 신경질환
- 기타
제7장 시장 추정·예측 : 최종 용도별, 2021-2034년
- 주요 동향
- 병원
- 안과 클리닉
- 기타
제8장 시장 추정·예측 : 지역별, 2021-2034년
- 주요 동향
- 북미
- 미국
- 캐나다
- 유럽
- 독일
- 영국
- 프랑스
- 스페인
- 이탈리아
- 네덜란드
- 아시아태평양
- 중국
- 일본
- 인도
- 호주
- 한국
- 라틴아메리카
- 브라질
- 멕시코
- 아르헨티나
- 중동 및 아프리카
- 남아프리카공화국
- 사우디아라비아
- 아랍에미리트
제9장 기업 개요
- Canon
- ESSILOR INSTRUMENTS
- HAAG-STREIT GROUP
- HEIDELBERG ENGINEERING
- Konan Medical
- Kowa
- MEDA
- Metrovision
- OCULUS
- Optopol
- Reichert AMETEK
- Rexxam
- TOPCON Healthcare
- Zeiss
The Global Automated Visual Field Analyzer Market reached USD 231.4 million in 2024 and is projected to grow at a CAGR of 5.8% between 2025 and 2034. This growth trajectory is fueled by technological advancements, a rising incidence of ophthalmic disorders, and increasing awareness of the critical role early diagnosis plays in preserving vision. Automated visual field analyzers have become indispensable in modern ophthalmology, aiding in the detection and monitoring of vision impairments with remarkable accuracy.

Technological innovations, particularly the integration of artificial intelligence and machine learning, have significantly enhanced the efficiency and precision of automated visual field analyzers. These advancements enable faster, more accurate results, meeting the growing demand for cutting-edge diagnostic tools in hospitals and specialized eye clinics. Additionally, user-friendly interfaces and enhanced testing capabilities have driven widespread adoption across diverse clinical environments, solidifying the role of these devices in modern eye care.
| Market Scope | |
|---|---|
| Start Year | 2024 |
| Forecast Year | 2025-2034 |
| Start Value | $231.4 Million |
| Forecast Value | $ 401.5 Million |
| CAGR | 5.8% |
The market is segmented by product type into static and kinetic analyzers. Static analyzers are set to witness steady growth, with a projected CAGR of 5.5%, reaching USD 276.1 million by 2034. These devices evaluate fixed points within a patient's visual field, offering highly accurate and reproducible data crucial for the early detection of visual impairments. Their reliability and ease of use make them a top choice for clinical diagnostics and research applications. The segment growth is further bolstered by the increasing prevalence of glaucoma, a leading cause of vision loss worldwide, particularly among aging populations.
By application, the market encompasses glaucoma, age-related macular degeneration (AMD), neurological disorders, and other uses. The glaucoma segment is expected to grow at a robust CAGR of 6.3%, generating USD 175.2 million by 2034. Rising cases of glaucoma, driven by risk factors such as diabetes and hypertension, underscore the need for advanced diagnostic tools. Automated visual field analyzers excel in detecting and monitoring glaucoma progression, providing opportunities for early intervention and reducing the risk of irreversible vision loss.
The U.S. market for automated visual field analyzers, valued at USD 76.9 million in 2024, is anticipated to grow at a CAGR of 4.8% through 2034. This growth is driven by the increasing prevalence of vision-related disorders, including glaucoma, AMD, and diabetic retinopathy. An aging population with a higher susceptibility to these conditions amplifies the need for regular eye examinations and advanced diagnostic technologies. Ongoing innovation, particularly the adoption of AI and ML, continues to enhance diagnostic accuracy and efficiency, fueling the adoption of these devices across the U.S. healthcare landscape.
Table of Contents
Chapter 1 Methodology and Scope
- 1.1 Market scope and definitions
- 1.2 Research design
- 1.2.1 Research approach
- 1.2.2 Data collection methods
- 1.3 Base estimates and calculations
- 1.3.1 Base year calculation
- 1.3.2 Key trends for market estimation
- 1.4 Forecast model
- 1.5 Primary research and validation
- 1.5.1 Primary sources
- 1.5.2 Data mining sources
Chapter 2 Executive Summary
- 2.1 Industry 3600 synopsis
Chapter 3 Industry Insights
- 3.1 Industry ecosystem analysis
- 3.2 Industry impact forces
- 3.2.1 Growth drivers
- 3.2.1.1 Rising prevalence of glaucoma and other eye disorders
- 3.2.1.2 Increased focus on early diagnosis
- 3.2.1.3 Adoption in neurological assessments
- 3.2.1.4 Rising demand for outpatient eye care
- 3.2.2 Industry pitfalls and challenges
- 3.2.2.1 High cost of devices
- 3.2.1 Growth drivers
- 3.3 Growth potential analysis
- 3.4 Regulatory landscape
- 3.5 Reimbursement scenario
- 3.6 Technology landscape
- 3.7 Gap analysis
- 3.8 Porter's analysis
- 3.9 PESTEL analysis
- 3.10 Future market trends
Chapter 4 Competitive Landscape, 2024
- 4.1 Introduction
- 4.2 Company matrix analysis
- 4.3 Company market share analysis
- 4.4 Competitive analysis of major market players
- 4.5 Competitive positioning matrix
- 4.6 Strategy dashboard
Chapter 5 Market Estimates and Forecast, By Product Type, 2021 – 2034 ($ Mn)
- 5.1 Key trends
- 5.2 Static
- 5.3 Kinetic
Chapter 6 Market Estimates and Forecast, By Application, 2021 – 2034 ($ Mn)
- 6.1 Key trends
- 6.2 Glaucoma
- 6.3 Age-related macular degeneration (AMD)
- 6.4 Neurological disorders
- 6.5 Other applications
Chapter 7 Market Estimates and Forecast, By End Use, 2021 – 2034 ($ Mn)
- 7.1 Key trends
- 7.2 Hospitals
- 7.3 Ophthalmic clinics
- 7.4 Other end users
Chapter 8 Market Estimates and Forecast, By Region, 2021 – 2034 ($ Mn)
- 8.1 Key trends
- 8.2 North America
- 8.2.1 U.S.
- 8.2.2 Canada
- 8.3 Europe
- 8.3.1 Germany
- 8.3.2 UK
- 8.3.3 France
- 8.3.4 Spain
- 8.3.5 Italy
- 8.3.6 Netherlands
- 8.4 Asia Pacific
- 8.4.1 China
- 8.4.2 Japan
- 8.4.3 India
- 8.4.4 Australia
- 8.4.5 South Korea
- 8.5 Latin America
- 8.5.1 Brazil
- 8.5.2 Mexico
- 8.5.3 Argentina
- 8.6 Middle East and Africa
- 8.6.1 South Africa
- 8.6.2 Saudi Arabia
- 8.6.3 UAE
Chapter 9 Company Profiles
- 9.1 Canon
- 9.2 ESSILOR INSTRUMENTS
- 9.3 HAAG-STREIT GROUP
- 9.4 HEIDELBERG ENGINEERING
- 9.5 Konan Medical
- 9.6 Kowa
- 9.7 MEDA
- 9.8 Metrovision
- 9.9 OCULUS
- 9.10 Optopol
- 9.11 Reichert AMETEK
- 9.12 Rexxam
- 9.13 TOPCON Healthcare
- 9.14 Zeiss

