
|
시장보고서
상품코드
1665419
자동차용 교통정체 지원 시스템 시장 기회, 성장 촉진요인, 산업 동향 분석 및 예측(2025-2034년)Traffic Jam Assist System Market Opportunity, Growth Drivers, Industry Trend Analysis, and Forecast 2025 - 2034 |
||||||
세계의 자동차용 교통정체 지원 시스템 시장 규모는 2024년 36억 달러로 평가되었습니다. 2025년부터 2034년까지 연평균 복합 성장률(CAGR) 11.5%로 성장할 것으로 예측됩니다.
이 성장은 급속한 인구 증가와 도시화로 인한 도시 지역의 교통 체증의 악화로 인한 것입니다. 자동차 보유 대수 증가와 한정된 인프라가 교통 문제를 더욱 악화시켜 통근 시간을 보다 길고 스트레스가 많은 것으로 하고 있습니다. 교통정체 지원 시스템은 정체시 가속, 브레이크, 스티어링 등 주요 운전 기능을 자동화하여 이를 완화하는 것을 목적으로 하고 있습니다. 이러한 기능은 드라이버의 피로를 경감할 뿐만 아니라, 부드러운 운전 패턴에 의해 연비도 향상시키고 있습니다. 보다 안전하고 편리한 도시형 이동성 솔루션에 대한 수요 증가는 특히 심각한 교통 체증 문제에 직면한 지역에서의 채택을 촉진하고 있습니다. 자동차 제조업체가 첨단 운전자 지원 기술을 자동차에 통합함에 따라 현대 이동성의 중요한 구성 요소로서 TJA 시스템의 역할이 현저해지고 있습니다.

자동차 제조업체 각사는 어댑티브 크루즈 컨트롤이나 레인 키핑 어시스턴스와 같은 TJA 기능에 필수적인 기능을 탑재하게 되어 왔습니다. 이 시스템은 운전자의 안전성을 보장하면서 저속으로 이동하는 교통에 대응하기 위해 다양한 기술을 결합합니다. 각국 정부가 안전규제를 강화하는 가운데 ADAS(첨단 운전자 지원 시스템의 채용이 가속화되고 있습니다. 보다 스마트한 자율주행 차량에 대한 소비자의 관심은 오늘날 시장에서 TJA 시스템의 중요성을 더욱 두드러뜨리고 있습니다.
| 시장 범위 | |
|---|---|
| 시작 연도 | 2024년 |
| 예측 연도 | 2025-2034년 |
| 시작 금액 | 36억 달러 |
| 예측 금액 | 104억 달러 |
| CAGR | 11.5% |
시장은 차종별로 구분되어 승용차가 2024년 시장 점유율의 70% 이상을 차지했습니다. 이 부문은 자동차의 고급 안전성과 편의성 기능에 대한 선호도가 높아지며 2034년에는 65억 달러 이상에 달할 것으로 예상됩니다. 도시 교통의 격화에 따라, 소비자는 운전 체험을 향상시키는 기술을 우선하게 되어 있어, 제조업체 각사는 중급 모델이나 고급 모델에 TJA 시스템을 탑재하게 되어 있습니다. 반자동 운전으로의 전환으로 이러한 기능은 많은 고급 차량에 표준 장착되어 기술에 민감한 구매자에게 호소합니다.
구성 요소별로 분류하면 센서는 2024년에 약 39% 시장 점유율을 차지했습니다. 레이더, LiDAR, 카메라의 기술 진보로 시스템의 정확성이 향상되어 차량이 물체를 감지하고 복잡한 교통 시나리오를 정확하게 탐색할 수 있게 되었습니다. 여러 소스의 입력을 결합한 센서 퓨전 기술의 통합은 실시간 의사결정을 강화하고, TJA 시스템의 신뢰성을 높이고 사용자에게 매력적입니다.
2024년 시장은 북미가 선도하여 세계 점유율의 약 35%를 차지했습니다. 규제 요건과 고급 기능을 갖춘 프리미엄 차량에 대한 소비자 수요 증가가 TJA 시스템의 채택을 뒷받침하고 있습니다. 이 지역의 자동차 제조업체들은 안전과 편의성에 대한 기대감을 높이기 위해 고급 차량과 중급 차량에 이러한 시스템을 적극적으로 통합하고 있습니다.
목차
제1장 조사 방법과 조사 범위
- 조사 디자인
- 조사 접근
- 데이터 수집 방법
- 기본 추정과 계산
- 기준연도의 산출
- 시장추계의 주요 동향
- 예측 모델
- 1차 조사와 검증
- 1차 정보
- 데이터 마이닝 소스
- 시장 범위와 정의
제2장 주요 요약
제3장 업계 인사이트
- 생태계 분석
- 원재료 공급자
- 부품 공급자
- 소프트웨어 개발 기업
- 기술 제공업체
- 애프터마켓 프로바이더
- 최종 사용자
- 공급자의 상황
- 이익률 분석
- 기술 혁신의 상황
- 코스트 내역 분석
- 가격 분석
- 특허 분석
- 주요 뉴스 및 이니셔티브
- 규제 상황
- 지역별 정체통계
- 영향요인
- 성장 촉진요인
- 도시의 교통 정체가 자율주행 시스템 수요를 촉진
- 정부의 안전 규정이 ADAS 기능의 채택 증가
- 센서, 카메라, AI의 진보가 TJA의 신뢰성 향상
- 통근할 때 편안함과 편의성을 선호하는 소비자
- 업계의 잠재적 위험 및 과제
- 높은 통합 비용
- 악천후나 복잡한 도로 상황에서의 시스템 성능 문제
- 성장 촉진요인
- 성장 가능성 분석
- Porter's Five Forces 분석
- PESTEL 분석
제4장 경쟁 구도
- 서론
- 기업 점유율 분석
- 경쟁 포지셔닝 매트릭스
- 전략 전망 매트릭스
제5장 시장 추계·예측 : 구성 요소별(2021-2034년), 10억 달러
- 주요 동향
- 센서
- 레이더
- LiDAR
- 초음파
- 기타
- ECU
- 액추에이터
- 카메라
- 기타
제6장 시장 추계·예측 : 차량별(2021-2034년), 10억 달러
- 주요 동향
- 승용차
- 세단
- 해치백
- SUV차
- 상용차
- 소형 상용차(LCV)
- 대형 상용차(HCV)
제7장 시장 추계·예측 : 자동화 레벨별(2021-2034년), 10억 달러
- 주요 동향
- 레벨 2
- 레벨 3
- 레벨 4
제8장 시장 추계·예측 : 방식별(2021-2034년), 10억 달러
- 주요 동향
- 차선 추적 시스템
- 차량 감지 및 충돌 방지 시스템
- 자동 조향 및 속도 제어 시스템
- V2X 통신 통합
- 기타
제9장 시장 추계·예측 : 통신별(2021-2034년), 10억 달러
- 주요 동향
- 차량간 통신(V2V)
- 차차간 통신(V2I)
- 셀룰러 네트워크 기반
- 전용 근거리 통신(DSRC)
제10장 시장 추계·예측 : 판매 채널별(2021-2034년), 10억 달러
- 주요 동향
- OEM
- 애프터마켓
제11장 시장 추계·예측 : 지역별(2021-2034년), 10억 달러
- 주요 동향
- 북미
- 미국
- 캐나다
- 유럽
- 영국
- 독일
- 프랑스
- 이탈리아
- 스페인
- 러시아
- 북유럽
- 아시아태평양
- 중국
- 인도
- 일본
- 호주
- 한국
- 동남아시아
- 라틴아메리카
- 브라질
- 멕시코
- 아르헨티나
- 중동 및 아프리카
- UAE
- 남아프리카
- 사우디아라비아
제12장 기업 프로파일
- Aptiv PLC
- Bosch
- Continental
- Denso
- Harman
- Hitachi Astemo
- Hyundai Mobis
- Infineon Technologies
- Magna International
- Marelli
- Mercedes-Benz
- Mobileye
- NVIDIA
- NXP Semiconductors
- Renesas Electronics
- Texas Instruments
- Valeo
- Veoneer
- Volkswagen
- ZF Friedrichshafen
The Global Traffic Jam Assist System Market was valued at USD 3.6 billion in 2024 and is projected to grow at a CAGR of 11.5% from 2025 to 2034. This growth stems from worsening traffic congestion in urban areas due to rapid population growth and urbanization. Increasing vehicle ownership and limited infrastructure further exacerbate traffic problems, making commutes longer and more stressful. Traffic jam assist systems aim to alleviate this by automating key driving functions like acceleration, braking, and steering in heavy traffic. These features not only reduce driver fatigue but also enhance fuel efficiency through smoother driving patterns. The growing demand for safer and more convenient urban mobility solutions is driving adoption, particularly in regions facing severe congestion challenges. As manufacturers integrate advanced driver-assistance technologies into vehicles, the role of TJA systems as a key component of modern mobility is becoming more pronounced.
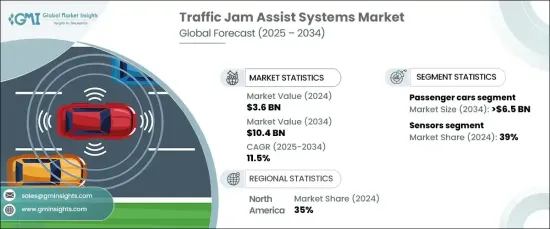
Automakers are increasingly incorporating features like adaptive cruise control and lane-keeping assistance, which are essential for TJA functionality. These systems combine various technologies to handle slow-moving traffic while ensuring driver safety. As governments enforce stricter safety regulations, the adoption of advanced driver-assistance systems is accelerating. Consumer interest in smarter, semi-autonomous vehicles further underscores the relevance of TJA systems in today's market.
| Market Scope | |
|---|---|
| Start Year | 2024 |
| Forecast Year | 2025-2034 |
| Start Value | $3.6 Billion |
| Forecast Value | $10.4 Billion |
| CAGR | 11.5% |
The market is segmented by vehicle type, with passenger cars accounting for over 70% of the market share in 2024. This segment is expected to exceed USD 6.5 billion by 2034, fueled by a growing preference for advanced safety and convenience features in vehicles. As urban traffic intensifies, consumers are prioritizing technologies that enhance driving experiences, prompting manufacturers to include TJA systems in mid-range and luxury models. The shift toward semi-autonomous driving has made these features standard in many high-end vehicles, appealing to tech-savvy buyers.
When categorized by components, sensors held a market share of approximately 39% in 2024. Technological advancements in radar, LiDAR, and cameras are improving system accuracy, enabling vehicles to detect objects and navigate complex traffic scenarios with precision. The integration of sensor fusion technologies, which combine inputs from multiple sources, enhances decision-making in real-time, making TJA systems more reliable and appealing to users.
North America led the market in 2024, capturing around 35% of the global share. Regulatory requirements and growing consumer demand for premium vehicles with advanced features have driven the adoption of TJA systems. Automakers in the region are actively integrating these systems into luxury and mid-range vehicles to meet evolving expectations for safety and convenience.
Table of Contents
Chapter 1 Methodology & Scope
- 1.1 Research design
- 1.1.1 Research approach
- 1.1.2 Data collection methods
- 1.2 Base estimates & calculations
- 1.2.1 Base year calculation
- 1.2.2 Key trends for market estimation
- 1.3 Forecast model
- 1.4 Primary research and validation
- 1.4.1 Primary sources
- 1.4.2 Data mining sources
- 1.5 Market scope & definition
Chapter 2 Executive Summary
- 2.1 Industry 3600 synopsis, 2021 - 2034
Chapter 3 Industry Insights
- 3.1 Industry ecosystem analysis
- 3.1.1 Raw material suppliers
- 3.1.2 Component suppliers
- 3.1.3 Software developers
- 3.1.4 Technology providers
- 3.1.5 Aftermarket providers
- 3.1.6 End users
- 3.2 Supplier landscape
- 3.3 Profit margin analysis
- 3.4 Technology & innovation landscape
- 3.5 Cost breakdown analysis
- 3.6 Price analysis
- 3.7 Patent analysis
- 3.8 Key news & initiatives
- 3.9 Regulatory landscape
- 3.10 Traffic congestion statistics, by region
- 3.11 Impact forces
- 3.11.1 Growth drivers
- 3.11.1.1 Urban traffic congestion is driving demand for automated driving systems
- 3.11.1.2 Government safety regulations are increasing the adoption of ADAS features
- 3.11.1.3 Advancements in sensors, cameras, and AI are improving the reliability of TJA
- 3.11.1.4 Consumers are prioritizing comfort and convenience in daily commutes
- 3.11.2 Industry pitfalls & challenges
- 3.11.2.1 High integration costs
- 3.11.2.2 System performance issues in adverse weather and complex road conditions
- 3.11.1 Growth drivers
- 3.12 Growth potential analysis
- 3.13 Porter’s analysis
- 3.14 PESTEL analysis
Chapter 4 Competitive Landscape, 2024
- 4.1 Introduction
- 4.2 Company market share analysis
- 4.3 Competitive positioning matrix
- 4.4 Strategic outlook matrix
Chapter 5 Market Estimates & Forecast, By Component, 2021 - 2034 ($Bn, Units)
- 5.1 Key trends
- 5.2 Sensors
- 5.2.1 Radar
- 5.2.2 LiDAR
- 5.2.3 Ultrasonic
- 5.2.4 Others
- 5.3 ECUs
- 5.4 Actuators
- 5.5 Cameras
- 5.6 Others
Chapter 6 Market Estimates & Forecast, By Vehicle, 2021 - 2034 ($Bn, Units)
- 6.1 Key trends
- 6.2 Passenger cars
- 6.2.1 Sedans
- 6.2.2 Hatchbacks
- 6.2.3 SUVs
- 6.3 Commercial vehicles
- 6.3.1 Light Commercial Vehicles (LCV)
- 6.3.2 Heavy Commercial Vehicles (HCV)
Chapter 7 Market Estimates & Forecast, By Level of Automation, 2021 - 2034 ($Bn, Units)
- 7.1 Key trends
- 7.2 Level 2
- 7.3 Level 3
- 7.4 Level 4
Chapter 8 Market Estimates & Forecast, By Method, 2021 - 2034 ($Bn, Units)
- 8.1 Key trends
- 8.2 Lane tracking system
- 8.3 Vehicle detection and collision avoidance system
- 8.4 Auto steering and speed control system
- 8.5 V2X communication integration
- 8.6 Others
Chapter 9 Market Estimates & Forecast, By Communication, 2021 - 2034 ($Bn, Units)
- 9.1 Key trends
- 9.2 Vehicle-to-Vehicle (V2V)
- 9.3 Vehicle-to-Infrastructure (V2I)
- 9.4 Cellular network-based
- 9.5 Dedicated Short-Range Communication (DSRC)
Chapter 10 Market Estimates & Forecast, By Sales Channel, 2021 - 2034 ($Bn, Units)
- 10.1 Key trends
- 10.2 OEM
- 10.3 Aftermarket
Chapter 11 Market Estimates & Forecast, By Region, 2021 - 2034 ($Bn, Units)
- 11.1 Key trends
- 11.2 North America
- 11.2.1 U.S.
- 11.2.2 Canada
- 11.3 Europe
- 11.3.1 UK
- 11.3.2 Germany
- 11.3.3 France
- 11.3.4 Italy
- 11.3.5 Spain
- 11.3.6 Russia
- 11.3.7 Nordics
- 11.4 Asia Pacific
- 11.4.1 China
- 11.4.2 India
- 11.4.3 Japan
- 11.4.4 Australia
- 11.4.5 South Korea
- 11.4.6 Southeast Asia
- 11.5 Latin America
- 11.5.1 Brazil
- 11.5.2 Mexico
- 11.5.3 Argentina
- 11.6 MEA
- 11.6.1 UAE
- 11.6.2 South Africa
- 11.6.3 Saudi Arabia
Chapter 12 Company Profiles
- 12.1 Aptiv PLC
- 12.2 Bosch
- 12.3 Continental
- 12.4 Denso
- 12.5 Harman
- 12.6 Hitachi Astemo
- 12.7 Hyundai Mobis
- 12.8 Infineon Technologies
- 12.9 Magna International
- 12.10 Marelli
- 12.11 Mercedes-Benz
- 12.12 Mobileye
- 12.13 NVIDIA
- 12.14 NXP Semiconductors
- 12.15 Renesas Electronics
- 12.16 Texas Instruments
- 12.17 Valeo
- 12.18 Veoneer
- 12.19 Volkswagen
- 12.20 ZF Friedrichshafen
