|
시장보고서
상품코드
1666585
층간 격리 시장 : 기회, 성장 촉진요인, 산업 동향 분석 및 예측(2025-2034년)Zonal Isolation Market Opportunity, Growth Drivers, Industry Trend Analysis, and Forecast 2025 - 2034 |
||||||
세계의 층간 격리 시장은 2024년에 249억 달러가 되었으며, 2025년부터 2034년에 걸쳐 CAGR5.2%로 안정된 성장이 예측되고 있습니다.
석유 및 가스 탐사에 대한 관심이 높아지고 해외 투자가 증가하면서 시장의 성장 궤도가 크게 변화하고 있습니다. 주요 촉인요인은 증가하는 에너지 수요에 대응하기 위한 석유 및 가스 기업의 자본 지출이 급증하고 있다는 점입니다. 유전 장비 및 서비스에 대한 이러한 수요 증가는 층간 격리 시장을 더욱 활성화할 것으로 예상됩니다.
대량의 석유와 가스를 생산할 수 있는 것으로 알려진 심해 및 초심해 유전을 활용하는 추세로 인해 효과적인 층간 격리 방법에 대한 필요성이 가속화되고 있습니다. 특히 이러한 심해 시추 작업은 유전 무결성을 확보하고 원치 않는 유체 이동을 방지하기 위한 고급 기술이 필요한 고유한 과제를 안고 있습니다. 층간 격리는 특히 기존 유전의 생산량이 감소하는 상황에서 이러한 문제를 해결하기 위한 솔루션이 될 수 있습니다.
| 시장 범위 | |
|---|---|
| 시작 연도 | 2024년 |
| 예측 연도 | 2025-2034년 |
| 시작 금액 | 249억 달러 |
| 예측 금액 | 411억 달러 |
| CAGR | 5.2% |
층간 격리 시장의 화학적 부문은 2034년까지 매출이 218억 달러를 넘어서는 등 상당한 성장이 예상됩니다. 이러한 성장은 특히 극한의 온도 환경에서 화학적 방법의 장기적인 안정성이 뛰어나기 때문입니다. 바이오 폴리머, 엘라스토머, 폴리머 젤을 사용하면 시멘트 및 시추 유체와의 호환성이 향상되어 천해 유전 및 심해 유전 모두에서 운영 효율성이 향상됩니다.
심해 및 초심해 탐사를 포함하는 해양 용도는 2034년까지 5.5% 이상의 연평균 성장률을 기록하며 시장 성장을 주도할 것으로 예상됩니다. 기업들은 이전에는 접근할 수 없었던 심해 지역의 미개발 매장량에 접근하기 위해 첨단 기술에 점점 더 많은 투자를 하고 있습니다. 얕은 수심과 육상 자원이 감소함에 따라 해양 기회 탐사를 향한 노력은 업계를 재편하여 상당한 성장 잠재력을 제시할 것으로 예상됩니다.
미국의 층간 격리 시장은 2034년까지 60억 달러를 넘어설 것으로 예상됩니다. 미국의 층간 격리 공법에 대한 수요는 많은 수의 성숙한 유전과 시추 활동을 지원하는 우호적인 규제 조치에 의해 주도되고 있습니다. 또한, 미국의 입증된 석유 매장량과 시추 프로젝트 증가는 사업자들이 기존 유전에서 생산량을 극대화하고 새로운 유전 개발을 모색하면서 시장 확대에 박차를 가하고 있습니다.
목차
제1장 조사 방법과 조사 범위
- 시장의 정의
- 기본 추정과 계산
- 예측 계산
- 데이터 출처
- 1차
- 2차
- 유상
- 공적
제2장 주요 요약
제3장 업계 인사이트
- 업계 생태계 분석
- 규제 상황
- 업계에 미치는 영향요인
- 성장 촉진요인
- 업계의 잠재적 위험 및 과제
- 성장 가능성 분석
- Porter's Five Forces 분석
- 공급기업의 협상력
- 구매자의 협상력
- 신규 참가업체의 위협
- 대체품의 위협
- PESTEL 분석
제4장 경쟁 구도
- 소개
- 전략 대시보드
- 혁신과 지속가능성의 전망
제5장 시장 규모와 예측 : 용도별(2021-2034년)
- 주요 동향
- 육상
- 해양
- 천해
- 심해
- 초심해
제6장 시장 규모와 예측 : 방식별(2021-2034년)
- 주요 동향
- 기계적
- 슬라이딩 슬리브
- 패커
- 펀칭 및 슬롯 라이너
- 기타
- 화학적
- 폴리머 젤
- 모노머 시스템
- 바이오 폴리머
- 엘라스토머
- 기타
제7장 시장 규모와 예측 : 지역별(2021-2034년)
- 주요 동향
- 북미
- 미국
- 캐나다
- 멕시코
- 유럽
- 영국
- 노르웨이
- 네덜란드
- 러시아
- 아시아태평양
- 중국
- 인도
- 호주
- 인도네시아
- 말레이시아
- 태국
- 중동 및 아프리카
- 사우디아라비아
- 아랍에미리트(UAE)
- 이집트
- 터키
- 앙골라
- 라틴아메리카
- 브라질
- 아르헨티나
제8장 기업 프로파일
- Archer
- Baker Hughes
- Calfrac Well Services
- Expro
- Halliburton
- Helix Energy Solutions
- Hunting Energy Services
- Hydra Well Intervention
- NOV
- Omega Well Intervention
- Schlumberger
- Superior Energy Services
- TAM International
- Trican
- Weatherford
- Wellcem
- Welltec
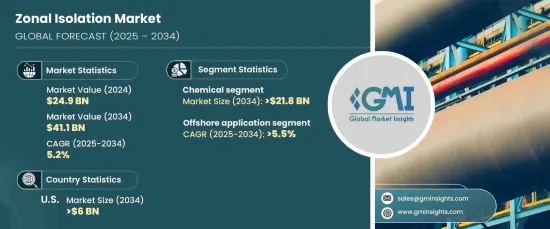
The Global Zonal Isolation Market was valued at USD 24.9 billion in 2024, with projections indicating a steady growth at a CAGR of 5.2% from 2025 to 2034. The increasing focus on oil and gas exploration, coupled with rising offshore investments, is significantly shaping the growth trajectory of the market. A key driver is the surge in capital expenditure from oil and gas companies as they respond to the growing demand for energy. This heightened demand for oilfield equipment and services is anticipated to further boost the zonal isolation market.

The trend of tapping into deeper and ultra-deep wells, known for their potential to yield high volumes of oil and gas, is accelerating the need for effective zonal isolation methods. These deep-water drilling operations, in particular, present unique challenges, requiring advanced techniques to secure well integrity and prevent unwanted fluid migration. Zonal isolation serves as a solution for addressing these issues, particularly as existing wells experience diminishing production rates.
| Market Scope | |
|---|---|
| Start Year | 2024 |
| Forecast Year | 2025-2034 |
| Start Value | $24.9 Billion |
| Forecast Value | $41.1 Billion |
| CAGR | 5.2% |
The chemical segment of the zonal isolation market is expected to gain significant traction, with revenues surpassing USD 21.8 billion by 2034. This growth is attributed to the superior long-term stability of chemical methods, particularly in extreme temperature environments. The use of bio polymers, elastomers, and polymer gels enhances their compatibility with cement and drilling fluids, improving operational efficiency in both shallow and deep well applications.
Offshore applications, which include deep and ultra-deep-water exploration, are also expected to drive market growth, with a CAGR exceeding 5.5% through 2034. Companies are increasingly investing in advanced technologies to access untapped reserves in previously unreachable deep-water locations. As shallow and onshore resources dwindle, the push toward exploring offshore opportunities is expected to reshape the industry, presenting significant growth potential.
The U.S. zonal isolation market is set to surpass USD 6 billion by 2034. The demand for zonal isolation methods in the U.S. is being driven by the large number of mature oilfields and favorable regulatory measures supporting drilling activities. Additionally, the country's proven oil reserves and increasing drilling projects are fueling market expansion as operators seek to maximize production from existing wells and develop new fields.
Table of Contents
Chapter 1 Methodology & Scope
- 1.1 Market definitions
- 1.2 Base estimates & calculations
- 1.3 Forecast calculation
- 1.4 Data sources
- 1.4.1 Primary
- 1.4.2 Secondary
- 1.4.2.1 Paid
- 1.4.2.2 Public
Chapter 2 Executive Summary
- 2.1 Industry synopsis, 2021 - 2034
Chapter 3 Industry Insights
- 3.1 Industry ecosystem analysis
- 3.2 Regulatory landscape
- 3.3 Industry impact forces
- 3.3.1 Growth drivers
- 3.3.2 Industry pitfalls & challenges
- 3.4 Growth potential analysis
- 3.5 Porter's analysis
- 3.5.1 Bargaining power of suppliers
- 3.5.2 Bargaining power of buyers
- 3.5.3 Threat of new entrants
- 3.5.4 Threat of substitutes
- 3.6 PESTEL analysis
Chapter 4 Competitive Landscape, 2024
- 4.1 Introduction
- 4.2 Strategic dashboard
- 4.3 Innovation & sustainability landscape
Chapter 5 Market Size and Forecast, By Application, 2021 – 2034 (USD Million)
- 5.1 Key trends
- 5.2 Onshore
- 5.3 Offshore
- 5.3.1 Shallow
- 5.3.2 Deep
- 5.3.3 Ultra-deep
Chapter 6 Market Size and Forecast, By Method, 2021 – 2034 (USD Million)
- 6.1 Key trends
- 6.2 Mechanical
- 6.2.1 Sliding sleeves
- 6.2.2 Packers
- 6.2.3 Perforated/Slotted liners
- 6.2.4 Others
- 6.3 Chemical
- 6.3.1 Polymer gels
- 6.3.2 Monomer systems
- 6.3.3 Bio-Polymers
- 6.3.4 Elastomers
- 6.3.5 Others
Chapter 7 Market Size and Forecast, By Region, 2021 – 2034 (USD Million)
- 7.1 Key trends
- 7.2 North America
- 7.2.1 U.S
- 7.2.2 Canada
- 7.2.3 Mexico
- 7.3 Europe
- 7.3.1 UK
- 7.3.2 Norway
- 7.3.3 Netherlands
- 7.3.4 Russia
- 7.4 Asia Pacific
- 7.4.1 China
- 7.4.2 India
- 7.4.3 Australia
- 7.4.4 Indonesia
- 7.4.5 Malaysia
- 7.4.6 Thailand
- 7.5 Middle East & Africa
- 7.5.1 Saudi Arabia
- 7.5.2 UAE
- 7.5.3 Egypt
- 7.5.4 Turkey
- 7.5.5 Angola
- 7.6 Latin America
- 7.6.1 Brazil
- 7.6.2 Argentina
Chapter 8 Company Profiles
- 8.1 Archer
- 8.2 Baker Hughes
- 8.3 Calfrac Well Services
- 8.4 Expro
- 8.5 Halliburton
- 8.6 Helix Energy Solutions
- 8.7 Hunting Energy Services
- 8.8 Hydra Well Intervention
- 8.9 NOV
- 8.10 Omega Well Intervention
- 8.11 Schlumberger
- 8.12 Superior Energy Services
- 8.13 TAM International
- 8.14 Trican
- 8.15 Weatherford
- 8.16 Wellcem
- 8.17 Welltec