|
시장보고서
상품코드
1666935
수송용 버스 시장 : 기회, 성장 촉진요인, 산업 동향 분석 및 예측(2025-2034년)Transit Bus Market Opportunity, Growth Drivers, Industry Trend Analysis, and Forecast 2025 - 2034 |
||||||
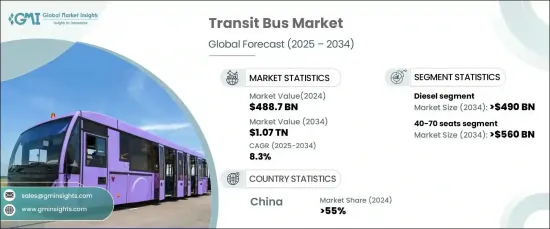
세계의 수송용 버스 시장은 큰 성장을 이루고 있으며, 2024년에는 4,887억 달러 규모에 이르렀으며, 2025년부터 2034년까지의 CAGR은 8.3%가 될 것으로 예측됩니다.
이 성장의 원동력이 되는 것은 세계의 도시화와 인구 밀도 증가입니다. 도시 지역이 확대됨에 따라 효율적이고 지속 가능한 대중 교통 솔루션에 대한 수요가 증가하고 있습니다. 교통은 인구 증가의 요구를 충족하고 이동성을 향상시키고 혼잡을 완화하기 위해 버스 네트워크의 현대화를 위해 노력하고 있습니다. 사용하기 쉽고 비용 효율적인 교통 수단에 대한 수요 증가는 실시간 추적 시스템과 더 스마트한 라우팅 솔루션과 같은 선진 기술에 대한 투자를 각국 정부에 촉구하고 버스를 경제 성장과 환경 목표를 모두 달성하는 열쇠로 자리 매김하고 있습니다.
지속 가능한 운송의 필요성도 교통 부문을 제로 방출 솔루션으로 밀어 올리고 있습니다. 세계 각국의 정부는 야심적인 이산화탄소 감축 목표를 달성하기 위해 전기 및 수소 버스의 도입을 의무화하고 있습니다. 배출량을 줄이기 위한 엄격한 규제와 정책을 통해 각국 정부는 보다 환경친화적인 기술로의 전환을 지원하기 위한 재정적 인센티브를 제공합니다. 보다 깨끗한 차량으로의 전환은 기후 변화에 대한 우려와 도시의 대기질 개선의 필요성에 직접적으로 대응합니다. 그 결과, 교통 부문의 기업은 전기 버스와 수소 버스를 차량에 통합하는 새로운 기회를 포착하고 있습니다.
| 시장 범위 | |
|---|---|
| 시작 연도 | 2024년 |
| 예측 연도 | 2025-2034년 |
| 시작 금액 | 4,887억 달러 |
| 예측 금액 | 1조 700억 달러 |
| CAGR | 8.3% |
시장은 연료 유형별로 구분되며, 디젤, CNG, 전기 및 기타가 주요 카테고리입니다. 현재 디젤버스는 시장을 독점하고 있으며 2024년 시장 점유율의 51% 이상을 차지했습니다. 그러나 선택적 촉매 환원(SCR)과 디젤 미립자 필터(DPF)와 같은 배출 가스 제어 기술의 발전으로 디젤 목욕은 더욱 엄격한 환경 기준을 충족할 수 있게 되었습니다. 하이브리드 디젤 - 전기 파워트레인도 인기를 끌고 있으며 전통적인 디젤 버스와 완전 전기 모델 사이의 과도한 선택을 제공합니다. 이 시스템은 디젤 엔진의 연비 효율과 회생 브레이크 및 최적화된 에너지 관리와 같은 전기 모터의 장점을 결합하여 완전 전기화로의 전환과 동시에 배출량을 줄이는 실행 가능한 솔루션입니다.
좌석 정원은 시장 형성에 중요한 역할을 하며, 버스는 일반적으로 40석 미만, 40석에서 70석, 70석 이상의 세 가지 범주로 분류됩니다. 40석에서 70석의 부문은 전동 파워트레인과 배터리 기술의 발전으로 2034년까지 5,600억 달러 이상에 달할 것으로 예상됩니다. 제조업체는 항속 거리, 충전 속도 및 비용 효율성을 향상시키기 위해 배터리 성능을 최적화하는 데 점점 더 주력하고 있습니다. 리튬 이온 배터리와 솔리드 스테이트 배터리의 기술 혁신은 운전 사이클의 연장과 생산 비용의 절감을 실현하여 전기 버스의 보급을 촉진할 것으로 예상됩니다.
지역별로 중국은 계속해서 세계의 수송용 버스 시장을 선도하고 있으며 2024년 매출의 55% 이상을 차지했습니다. 배출가스 감축과 대기환경 개선을 목적으로 한 정부의 엄격한 정책이 전기버스로의 이동을 가속화하고 있습니다. 특히 대도시에서는 전기 버스가 대중 교통 시스템의 중요한 부분이되었습니다. 중국의 선도적인 제조업체는 이 혁신에서 중요한 역할을 수행하고 완전한 전기 대중 교통 차량을 실현하는 중국의 목표에 기여합니다.
목차
제1장 조사 방법과 조사 범위
- 조사 디자인
- 조사 접근
- 데이터 수집 방법
- 기본 추정과 계산
- 기준연도의 산출
- 시장추계의 주요 동향
- 예측 모델
- 1차 조사와 검증
- 1차 소스
- 데이터 마이닝 소스
- 시장 정의
제2장 주요 요약
제3장 업계 인사이트
- 업계 생태계 분석
- 공급자의 상황
- 부품 제조업체
- 자동차 OEM
- Tier 1 공급업체
- 충전 인프라 공급자
- 최종 용도
- 이익률 분석
- 기술차별화 요인
- 전동 파워트레인 기술
- 반자율 주행 기능
- IoT 통합
- 수소 연료전지 기술
- 기타
- 주요 뉴스와 대처
- 특허 분석
- 규제 상황
- 영향요인
- 성장 촉진요인
- 도시화의 진전과 도시에서의 인구밀도 증가
- 환경규제 도입 확대
- 수송 버스의 전동화의 진전
- 대중교통에 대한 인프라 투자 확대
- 업계의 잠재적 리스크 및 과제
- 초기 투자비용 높이
- 충전 인프라 규제
- 성장 촉진요인
- 성장 가능성 분석
- Porter's Five Forces 분석
- PESTEL 분석
제4장 경쟁 구도
- 서론
- 기업의 시장 점유율 분석
- 경쟁 포지셔닝 매트릭스
- 전략 전망 매트릭스
제5장 시장 추계·예측 : 연료별(2021-2034년)
- 주요 동향
- 디젤
- 압축천연가스(CNG)
- 전기자동차
- 배터리 전기자동차
- 연료전지 전기자동차
- 하이브리드 전기자동차
제6장 시장 추계·예측 : 승차 정원별(2021-2034년)
- 주요 동향
- 40석 미만
- 도심 수송
- 교외 수송
- 시외 수송
- 기타
- 40-70석
- 도심 수송
- 교외 수송
- 시외 수송
- 기타
- 70석 이상
- 시외 수송
- 교외 수송
- 시외 수송
- 기타
제7장 시장 추계·예측 : 용도별(2021-2034년)
- 주요 동향
- 도심 수송
- 교외 수송
- 시외 수송
- 기타
제8장 시장 추계·예측 : 지역별(2021-2034년)
- 주요 동향
- 북미
- 미국
- 캐나다
- 유럽
- 영국
- 독일
- 프랑스
- 스페인
- 이탈리아
- 러시아
- 북유럽
- 아시아태평양
- 중국
- 인도
- 일본
- 한국
- 뉴질랜드
- 동남아시아
- 라틴아메리카
- 브라질
- 멕시코
- 아르헨티나
- 중동 및 아프리카
- UAE
- 남아프리카
- 사우디아라비아
제9장 기업 프로파일
- Anhui Ankai Automobile
- Ashok Leyland
- Beiqi Foton Motor
- BYD
- Daimler
- Ebusco
- Irizar Group
- IVECO
- King Long United Automotive Industry
- MAN
- NFI Group
- Proterra
- Scania
- Solaris Bus &Couch
- TATA Motors
- VDL Bus &Coach
- Volvo
- Xiamen Golden Dragon Bus
- Yutong
- Zhengzhou Yutong Bus
- Zhongtong Bus
The Global Transit Bus Market is experiencing significant growth, projected to reach a value of USD 488.7 billion by 2024, with an expected CAGR of 8.3% from 2025 to 2034. This growth is driven by urbanization and the increasing density of populations in cities worldwide. As urban areas expand, the demand for efficient, sustainable public transportation solutions is intensifying. Transit agencies are working to modernize bus networks to meet the needs of growing populations, improve mobility, and reduce congestion. The rising demand for accessible, cost-effective transport options is further motivating governments to invest in advanced technologies like real-time tracking systems and smarter routing solutions, positioning buses as key to achieving both economic growth and environmental goals.

The need for sustainable transportation is also pushing the transit sector towards zero-emission solutions. Governments worldwide are mandating the adoption of electric and hydrogen-powered buses to meet ambitious carbon reduction targets. With strict regulations and policies aimed at reducing emissions, governments are offering financial incentives to support the shift toward greener technologies. This transition to cleaner vehicles is a direct response to climate change concerns and the need for better urban air quality. As a result, businesses in the transit sector are seizing new opportunities to integrate electric and hydrogen-powered buses into their fleets.
| Market Scope | |
|---|---|
| Start Year | 2024 |
| Forecast Year | 2025-2034 |
| Start Value | $488.7 Billion |
| Forecast Value | $1.07 Trillion |
| CAGR | 8.3% |
The market is segmented by fuel type, with diesel, CNG, electric, and others being the key categories. Diesel buses currently dominate the market, holding over 51% of the market share in 2024. However, advancements in emission control technologies, such as selective catalytic reduction (SCR) and diesel particulate filters (DPF), are enabling diesel buses to meet increasingly stringent environmental standards. Hybrid diesel-electric powertrains are also gaining popularity, providing a transitional option between traditional diesel buses and fully electric models. These systems combine the fuel efficiency of diesel engines with the benefits of electric motors, such as regenerative braking and optimized energy management, making them a viable solution for reducing emissions while transitioning to full electrification.
Seating capacity plays a significant role in shaping the market, with buses typically falling into three categories: below 40 seats, 40-70 seats, and above 70 seats. The 40-70 seat segment is anticipated to exceed USD 560 billion by 2034, driven by advances in electric powertrains and battery technologies. Manufacturers are increasingly focused on optimizing battery performance to improve range, charging speed, and cost-efficiency. Innovations in lithium-ion and solid-state batteries are expected to extend operational cycles and lower production costs, facilitating wider adoption of electric buses.
In terms of regional markets, China continues to lead the global transit bus market, contributing over 55% of revenue in 2024. Stringent government policies aimed at reducing emissions and improving air quality have accelerated the shift to electric buses. Generous government subsidies and incentives have played a significant role in supporting the adoption of electric buses, particularly in major cities where these buses are becoming a crucial part of public transport systems. Leading manufacturers in China are playing a vital role in this transformation, contributing to the country's goal of achieving a fully electric public transport fleet.
Table of Contents
Chapter 1 Methodology & Scope
- 1.1 Research design
- 1.1.1 Research approach
- 1.1.2 Data collection methods
- 1.2 Base estimates and calculations
- 1.2.1 Base year calculation
- 1.2.2 Key trends for market estimates
- 1.3 Forecast model
- 1.4 Primary research & validation
- 1.4.1 Primary sources
- 1.4.2 Data mining sources
- 1.5 Market definitions
Chapter 2 Executive Summary
- 2.1 Industry 3600 synopsis, 2021 - 2034
Chapter 3 Industry Insights
- 3.1 Industry ecosystem analysis
- 3.2 Supplier landscape
- 3.2.1 Component manufacturers
- 3.2.2 Automotive OEM
- 3.2.3 Tier-1 suppliers
- 3.2.4 Charging infrastructure providers
- 3.2.5 End use
- 3.3 Profit margin analysis
- 3.4 Technology differentiators
- 3.4.1 Electric powertrain technology
- 3.4.2 Semi-autonomous capabilities
- 3.4.3 IoT integration
- 3.4.4 Hydrogen fuel cell technology
- 3.4.5 Others
- 3.5 Key news & initiatives
- 3.6 Patent analysis
- 3.7 Regulatory landscape
- 3.8 Impact forces
- 3.8.1 Growth drivers
- 3.8.1.1 Growing urbanization and increasing population density in urban areas
- 3.8.1.2 Growing adoption of environmental regulations
- 3.8.1.3 Growing electrification of transit buses
- 3.8.1.4 Growing infrastructure investments in public transportation
- 3.8.2 Industry pitfalls & challenges
- 3.8.2.1 High initial investment costs
- 3.8.2.2 Charging infrastructure regulations
- 3.8.1 Growth drivers
- 3.9 Growth potential analysis
- 3.10 Porter’s analysis
- 3.11 PESTEL analysis
Chapter 4 Competitive Landscape, 2024
- 4.1 Introduction
- 4.2 Company market share analysis
- 4.3 Competitive positioning matrix
- 4.4 Strategic outlook matrix
Chapter 5 Market Estimates & Forecast, By Fuel, 2021 - 2034 ($Bn, Units)
- 5.1 Key trends
- 5.2 Diesel
- 5.3 Compressed natural gas (CNG)
- 5.4 Electric
- 5.4.1 Battery electric vehicle
- 5.4.2 Fuel cell electric vehicle
- 5.4.3 Hybrid electric vehicle
Chapter 6 Market Estimates & Forecast, By Seating Capacity, 2021 - 2034 ($Bn, Units)
- 6.1 Key trends
- 6.2 Below 40 seats
- 6.2.1 Urban transit
- 6.2.2 Suburban transit
- 6.2.3 Intercity
- 6.2.4 Others
- 6.3 40-70 seats
- 6.3.1 Urban transit
- 6.3.2 Suburban transit
- 6.3.3 Intercity
- 6.3.4 Others
- 6.4 Above 70 seats
- 6.4.1 Urban transit
- 6.4.2 Suburban transit
- 6.4.3 Intercity
- 6.4.4 Others
Chapter 7 Market Estimates & Forecast, By Application, 2021 - 2034 ($Bn, Units)
- 7.1 Key trends
- 7.2 Urban transit
- 7.3 Suburban transit
- 7.4 Intercity
- 7.5 Others
Chapter 8 Market Estimates & Forecast, By Region, 2021 - 2034 ($Bn, Units)
- 8.1 Key trends
- 8.2 North America
- 8.2.1 U.S.
- 8.2.2 Canada
- 8.3 Europe
- 8.3.1 UK
- 8.3.2 Germany
- 8.3.3 France
- 8.3.4 Spain
- 8.3.5 Italy
- 8.3.6 Russia
- 8.3.7 Nordics
- 8.4 Asia Pacific
- 8.4.1 China
- 8.4.2 India
- 8.4.3 Japan
- 8.4.4 South Korea
- 8.4.5 ANZ
- 8.4.6 Southeast Asia
- 8.5 Latin America
- 8.5.1 Brazil
- 8.5.2 Mexico
- 8.5.3 Argentina
- 8.6 MEA
- 8.6.1 UAE
- 8.6.2 South Africa
- 8.6.3 Saudi Arabia
Chapter 9 Company Profiles
- 9.1 Anhui Ankai Automobile
- 9.2 Ashok Leyland
- 9.3 Beiqi Foton Motor
- 9.4 BYD
- 9.5 Daimler
- 9.6 Ebusco
- 9.7 Irizar Group
- 9.8 IVECO
- 9.9 King Long United Automotive Industry
- 9.10 MAN
- 9.11 NFI Group
- 9.12 Proterra
- 9.13 Scania
- 9.14 Solaris Bus & Couch
- 9.15 TATA Motors
- 9.16 VDL Bus & Coach
- 9.17 Volvo
- 9.18 Xiamen Golden Dragon Bus
- 9.19 Yutong
- 9.20 Zhengzhou Yutong Bus
- 9.21 Zhongtong Bus