|
시장보고서
상품코드
1913376
카고 밴 시장 : 시장 기회, 성장 촉진요인, 산업 동향 분석, 예측(2026-2035년)Cargo Vans Market Opportunity, Growth Drivers, Industry Trend Analysis, and Forecast 2026 - 2035 |
||||||
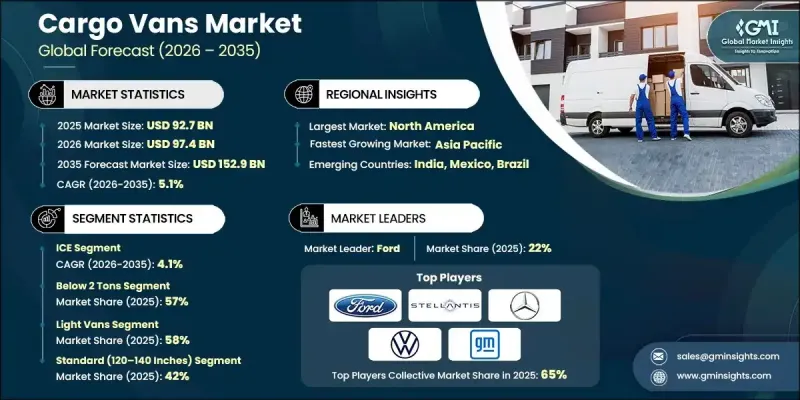
세계의 카고 밴 시장은 2025년에 927억 달러로 평가되었고, 2035년까지 연평균 복합 성장률(CAGR) 5.1%로 성장할 전망이며, 1,529억 달러에 이를 것으로 예측됩니다.

시장 확대 배경은 도시 지역 물류 활동의 꾸준한 증가 및 세계의 효율적인 상용 운송 솔루션에 대한 수요 증가를 포함합니다. 전자상거래 플랫폼, 소매 유통 네트워크, 서비스 산업의 급속한 성장으로 도시와 교외 지역에서 화물 운송을 지원하는 카고 밴에 대한 수요가 크게 증가하고 있습니다. 소포 취급량 증가 및 차량 가동 시간의 연장은 물류 사업자에게 신뢰성과 비용 효율적인 차량에 대한 투자를 촉구하고 있습니다. 동시에, 연비 효율 향상 및 배출 가스 삭감을 요구하는 규제 압력에 의해 차량 갱신 사이클에 영향이 생기고 있어, 사업자님은 성능 향상 및 운용 비용 삭감을 실현한 신형 카고 밴의 도입을 추진하고 있습니다. 차량 설계, 구동계 기술, 내구성의 지속적인 진보로 카고 밴의 신뢰성과 가동 수명이 더욱 향상되고 있습니다. 도시의 확대가 계속되는 가운데, 라스트마일 배송의 중요성이 증가함에 따라, 카고 밴은 현대의 수송 및 유통 에코시스템에 있어서의 중요한 구성 요소로서 대두해, 지역을 불문하고 지속적인 시장 성장을 지지하고 있습니다.
| 시장 범위 | |
|---|---|
| 시작 연도 | 2025년 |
| 예측 기간 | 2026-2035년 |
| 당초 시장 규모 | 927억 달러 |
| 시장 규모 예측 | 1,529억 달러 |
| CAGR | 5.1% |
2톤 미만 부문은 2025년에 57.4%의 점유율을 차지하였고, 2026-2035년 CAGR 4.7%로 성장할 것으로 예측됩니다. 이 적재량 카테고리의 카고 밴은 그 이동성, 효율성, 충분한 적재 능력으로부터, 라스트 마일 배송 및 서비스 업무로 널리 선호되고 있습니다. 밀집한 도시 환경에서 효율적으로 가동하면서 일상적인 배송 요건을 충족하는 능력이 계속해서 높은 채용률을 지지하고 있습니다.
휠베이스가 120-140인치인 표준 카고 밴은 2025년에 42%의 점유율을 차지했습니다. 이러한 차량은 적재 공간 및 조종성의 균형이 뛰어나 지역 배송 및 여러 거점 배송 경로에서 널리 활용되고 있습니다. 이 구성은 물류 사업자에게 효율적인 경로 계획 및 플릿 가동률 극대화를 지원합니다.
미국의 카고 밴 시장은 2025년에 88.5%의 점유율을 차지하였으며, 265억 달러 시장 규모를 창출했습니다. 물류, EC 완성, 서비스업의 급속한 확대가 수요를 견인하고 있으며, 기업은 상용차 함대의 근대화 및 확충을 추진하고 있습니다.
자주 묻는 질문
목차
제1장 분석 방법 및 범위
제2장 주요 요약
제3장 업계 인사이트
- 업계의 생태계 분석
- 공급자의 상황
- 이익률 분석
- 비용 구조
- 각 단계에서의 부가가치
- 밸류체인에 영향을 주는 요인
- 혁신
- 업계에 미치는 영향요인
- 성장 촉진요인
- 도시 물류 및 라스트 마일 배송의 성장
- 전자상거래 및 조직화 소매업 확대
- 플릿의 갱신 및 효율 개선
- 대체 파워트레인 도입
- 업계의 잠재적 위험 및 과제
- 높은 차량 취득 비용
- 도시의 정체 및 주차 공간의 제약
- 시장 기회
- 상용 차량의 전동화
- 콜드체인 및 전문 물류 분야의 성장
- 신흥 시장에서의 사업 확대
- 성장 촉진요인
- 성장 가능성 분석
- 규제 상황
- 북미
- 연방 자동차 운송 안전국(FMCSA) 규제
- 환경보호청(EPA) 배출 기준
- 캘리포니아주 대기자원국(CARB) 규제
- 유럽
- EU 상용차 규제
- 유로6 배출가스 규제
- 일반 안전 규제(GSR)
- EU 형식 인증 프레임워크
- 디지털 타코그래프 규칙
- 저배출 존(LEZ) 및 제로 배출 존(ZEZ)
- 아시아태평양
- 중국 국가 VI 배출 가스 규제 기준
- 인도 자동차 산업 규격(AIS)
- 일본의 연비 기준
- ASEAN 자동차 규제
- 대형 및 중형 차량 규제
- 라틴아메리카
- 브라질 Proconve 배출 가스 기준
- 아르헨티나 연비 기준(CAFE) 및 안전 기준
- 멕시코 NOM 규격
- USMCA(미국, 멕시코 및 캐나다 협정)에 있어서 차량 규제의 무결성
- 중동 및 아프리카
- 아랍에미리트(UAE) 운송법
- 사우디아라비아 운송 및 물류 규제
- 남아프리카 도로 교통법
- 동아프리카 공동체(EAC) 차량 규제
- 북미
- Porter's Five Forces 분석
- PESTEL 분석
- 기술 및 혁신 동향
- 현재 기술 동향
- 신흥 기술
- 가격 동향
- 지역별
- 제품별
- 생산 통계
- 생산 거점
- 소비 거점
- 수출입
- 비용 내역 분석
- 차량 취득 비용
- 운송 및 배송 비용
- 운용 및 보수 비용
- 규제 및 컴플라이언스 비용
- 연료 및 에너지 비용
- 특허 분석
- 지속가능성 및 환경면
- 지속가능한 실천
- 폐기물 감축 전략
- 생산에 있어서의 에너지 효율
- 환경에 배려한 대처
- 탄소발자국에 관한 고려 사항
- 시장 진출 전략
- 지역별 시장 침투 전략
- 신규 진출 기업의 주요 규제 고려 사항
- 가격 설정, 서비스, 차별화 전략
제4장 경쟁 구도
- 서문
- 기업별 시장 점유율 분석
- 지역별
- 북미
- 유럽
- 아시아태평양
- 라틴아메리카
- 중동 및 아프리카
- 지역별
- 주요 기업의 경쟁 분석
- 경쟁 포지셔닝 매트릭스
- 전략적 전망 매트릭스
- 주요 동향
- 기업 합병 및 인수(M&A)
- 제휴 및 협업
- 신제품 발매
- 사업 확대 계획 및 자금 조달
제5장 시장의 추정 및 예측 : 추진력별(2022-2035년)
- 내연기관(ICE)
- 전동
- 배터리식 전기자동차(BEV)
- 하이브리드 자동차(HEV)
- 플러그인 하이브리드 자동차(PHEV)
제6장 시장의 추정 및 예측 : 적재량별(2022-2035년)
- 2톤 미만
- 2-3톤
- 3톤 이상
제7장 시장의 추정 및 예측 : 차종별(2022-2035년)
- 소형 밴(클래스 1-2)
- 중형 밴(클래스 3)
- 대형 및 스텝밴(클래스 4-6)
제8장 시장의 추정 및 예측 : 휠 베이스 및 사이즈별(2022-2035년)
- 컴팩트(휠베이스 120인치 미만)
- 표준(120-140인치)
- 연장(140-160인치)
- 초장척(160인치 이상과)
제9장 시장의 추정 및 예측 : 상업 용도별(2022-2035년)
- 라스트마일 배송
- 택배 우편 및 소포
- 현장 서비스
- 기타
제10장 시장의 추정 및 예측 : 판매 채널별(2022-2035년)
- OEM
- 정규 판매점 네트워크
제11장 시장의 추정 및 예측 : 지역별(2022-2035년)
- 북미
- 미국
- 캐나다
- 유럽
- 독일
- 영국
- 프랑스
- 이탈리아
- 스페인
- 러시아
- 북유럽 국가
- 네덜란드
- 스웨덴
- 아시아태평양
- 중국
- 인도
- 일본
- 호주
- 한국
- 싱가포르
- 태국
- 인도네시아
- 베트남
- 라틴아메리카
- 브라질
- 멕시코
- 아르헨티나
- 중동 및 아프리카
- 남아프리카
- 사우디아라비아
- 아랍에미리트(UAE)
- 튀르키예
제12장 기업 프로파일
- 세계 기업
- Ford
- General Motors
- Hyundai/Kia
- Mercedes-Benz Vans
- Nissan
- Renault Group
- SAIC
- Stellantis
- Toyota
- Volkswagen
- 지역 기업
- BYD
- Changan Automobile
- Dongfeng Motor Corporation
- GAC Group
- Isuzu Motors
- Iveco
- 신흥 기업 및 디스럽터 기업
- Arrival
- Greenkraft
- Rivian
- Workhorse Group
The Global Cargo Vans Market was valued at USD 92.7 billion in 2025 and is estimated to grow at a CAGR of 5.1% to reach USD 152.9 billion by 2035.
Market expansion is driven by the steady rise in urban logistics activities and increasing demand for efficient commercial transportation solutions worldwide. The rapid growth of e-commerce platforms, retail distribution networks, and service-based industries is significantly increasing the need for cargo vans to support goods movement across both urban and semi-urban areas. Rising parcel volumes and extended fleet utilization are encouraging logistics providers to invest in reliable and cost-efficient vehicles. At the same time, regulatory pressure to improve fuel efficiency and reduce emissions is influencing fleet replacement cycles, pushing operators toward newer cargo van models with enhanced performance and lower operating expenses. Continuous advancements in vehicle design, drivetrain technologies, and durability are further improving the reliability and operational lifespan of cargo vans. As cities continue to expand and last-mile delivery becomes increasingly critical, cargo vans are emerging as a vital component of modern transportation and distribution ecosystems, supporting sustained market growth across regions.
| Market Scope | |
|---|---|
| Start Year | 2025 |
| Forecast Year | 2026-2035 |
| Start Value | $92.7 Billion |
| Forecast Value | $152.9 Billion |
| CAGR | 5.1% |
The below 2 tons segment accounted for a 57.4% share in 2025 and is expected to grow at a CAGR of 4.7% from 2026 to 2035. Cargo vans within this payload category are widely preferred for last-mile deliveries and service operations due to their maneuverability, efficiency, and adequate load capacity. Their ability to operate efficiently in dense urban settings while meeting daily delivery requirements continues to support strong adoption.
The standard cargo vans with a wheelbase ranging between 120 and 140 inches held a 42% share in 2025. These vehicles are extensively used for regional distribution and multi-stop delivery routes, as they offer an optimal balance between cargo space and ease of navigation. Their configuration supports efficient route planning and maximized fleet utilization for logistics operators.
United States Cargo Vans Market held 88.5% share, generating USD 26.5 billion in 2025. Strong demand is being driven by the rapid expansion of logistics, e-commerce fulfillment, and service-oriented businesses, prompting companies to modernize and expand their commercial vehicle fleets.
Key companies operating in the Global Cargo Vans Market include Ford, Toyota, Volkswagen, Stellantis, Mercedes-Benz Vans, General Motors, Hyundai/Kia, Rivian, SAIC through its Maxus and LDV brands, and the Shyft Group. Companies in the Global Cargo Vans Market are reinforcing their competitive position by focusing on product innovation, efficiency improvements, and portfolio diversification. Manufacturers are investing in advanced powertrain technologies and lightweight vehicle designs to meet evolving regulatory requirements and reduce the total cost of ownership for fleet operators. Strategic partnerships with logistics providers and fleet customers are being leveraged to secure long-term contracts and stable demand. Many players are also expanding manufacturing capabilities and regional footprints to improve supply chain resilience and delivery timelines.
Table of Contents
Chapter 1 Methodology
- 1.1 Market scope and definition
- 1.2 Research design
- 1.2.1 Research approach
- 1.2.2 Data collection methods
- 1.3 Data mining sources
- 1.3.1 Global
- 1.3.2 Regional/Country
- 1.4 Base estimates and calculations
- 1.4.1 Base year calculation
- 1.4.2 Key trends for market estimation
- 1.5 Primary research and validation
- 1.5.1 Primary sources
- 1.6 Forecast model
- 1.7 Research assumptions and limitations
Chapter 2 Executive Summary
- 2.1 Industry 3600 synopsis, 2022 - 2035
- 2.2 Key market trends
- 2.2.1 Regional
- 2.2.2 Propulsion
- 2.2.3 Tonnage Capacity
- 2.2.4 Vehicle Class
- 2.2.5 Wheelbase & Size
- 2.2.6 Commercial End Use
- 2.2.7 Sales Channel
- 2.3 TAM Analysis, 2026-2035
- 2.4 CXO perspectives: Strategic imperatives
- 2.4.1 Executive decision points
- 2.4.2 Critical success factors
- 2.5 Future outlook and strategic recommendations
Chapter 3 Industry Insights
- 3.1 Industry ecosystem analysis
- 3.1.1 Supplier landscape
- 3.1.2 Profit margin analysis
- 3.1.3 Cost structure
- 3.1.4 Value addition at each stage
- 3.1.5 Factor affecting the value chain
- 3.1.6 Disruptions
- 3.2 Industry impact forces
- 3.2.1.1 Growth drivers
- 3.2.1.2 Growth of urban logistics and last mile delivery
- 3.2.1.3 Expansion of e commerce and organized retail
- 3.2.1.4 Fleet renewal and efficiency improvement
- 3.2.1.5 Adoption of alternative powertrains
- 3.2.2 Industry pitfalls and challenges
- 3.2.2.1 High vehicle acquisition costs
- 3.2.2.2 Urban congestion and parking limitations
- 3.2.3 Market opportunities
- 3.2.3.1 Electrification of commercial fleets
- 3.2.3.2 Growth in cold chain and specialized logistics
- 3.2.3.3 Expansion in emerging markets
- 3.3 Growth potential analysis
- 3.4 Regulatory landscape
- 3.4.1 North America
- 3.4.1.1 Federal Motor Carrier Safety Administration (FMCSA) Regulations
- 3.4.1.2 Environmental Protection Agency (EPA) Emission Standards
- 3.4.1.3 California Air Resources Board (CARB) Regulations
- 3.4.2 Europe
- 3.4.2.1 EU Commercial Vehicle Regulations
- 3.4.2.2 Euro 6 Emission Standards
- 3.4.2.3 General Safety Regulation (GSR)
- 3.4.2.4 EU Type Approval Framework
- 3.4.2.5 Digital Tachograph Rules
- 3.4.2.6 Low Emission Zones (LEZ) and Zero Emission Zones (ZEZ)
- 3.4.3 Asia Pacific
- 3.4.3.1 China National VI Emission Standards
- 3.4.3.2 India Automotive Industry Standards (AIS)
- 3.4.3.3 Japan Fuel Economy Standards
- 3.4.3.4 ASEAN Automotive Regulations
- 3.4.3.5 Heavy and Medium Duty Vehicle Regulations
- 3.4.4 Latin America
- 3.4.4.1 Brazil Proconve Emission Standards
- 3.4.4.2 Argentina CAFE and Safety Standards
- 3.4.4.3 Mexico NOM Standards
- 3.4.4.4 USMCA Vehicle Regulatory Alignment
- 3.4.5 Middle East & Africa
- 3.4.5.1 UAE Federal Transport Law
- 3.4.5.2 Saudi Transport and Logistics Regulations
- 3.4.5.3 South African Road Traffic Act
- 3.4.5.4 East African Community (EAC) Vehicle Regulations
- 3.4.1 North America
- 3.5 Porter's analysis
- 3.6 PESTEL analysis
- 3.7 Technology and innovation landscape
- 3.7.1 Current technological trends
- 3.7.2 Emerging technologies
- 3.8 Price trends
- 3.8.1 By region
- 3.8.2 By product
- 3.9 Production statistics
- 3.9.1 Production hubs
- 3.9.2 Consumption hubs
- 3.9.3 Export and import
- 3.10 Cost breakdown analysis
- 3.10.1 Vehicle acquisition costs
- 3.10.2 Transportation and delivery costs
- 3.10.3 Operational and maintenance costs
- 3.10.4 Regulatory and compliance costs
- 3.10.5 Fuel and energy costs
- 3.11 Patent analysis
- 3.12 Sustainability and environmental aspects
- 3.12.1 Sustainable practices
- 3.12.2 Waste reduction strategies
- 3.12.3 Energy efficiency in production
- 3.12.4 Eco-friendly Initiatives
- 3.12.5 Carbon footprint considerations
- 3.13 Go-to-Market strategies
- 3.13.1 Region-specific market penetration strategies
- 3.13.2 Key regulatory considerations for new entrants
- 3.13.3 Pricing, service, and differentiation strategies
Chapter 4 Competitive Landscape, 2025
- 4.1 Introduction
- 4.2 Company market share analysis
- 4.2.1 North America
- 4.2.2 Europe
- 4.2.3 Asia Pacific
- 4.2.4 LATAM
- 4.2.5 MEA
- 4.3 Competitive analysis of major market players
- 4.4 Competitive positioning matrix
- 4.5 Strategic outlook matrix
- 4.6 Key developments
- 4.6.1 Mergers & acquisitions
- 4.6.2 Partnerships & collaborations
- 4.6.3 New Product Launches
- 4.6.4 Expansion Plans and funding
Chapter 5 Market Estimates & Forecast, By Propulsion, 2022 - 2035 ($Bn, Units)
- 5.1 Key trends
- 5.2 ICE
- 5.3 Electric
- 5.3.1 Battery Electric Vehicle (BEV)
- 5.3.2 Hybrid Electric Vehicle (HEV)
- 5.3.3 Plug-in Hybrid Electric Vehicle (PHEV)
Chapter 6 Market Estimates & Forecast, By Tonnage Capacity, 2022 - 2035 ($Bn, Units)
- 6.1 Key trends
- 6.2 Below 2 tons
- 6.3 2 to 3 tons
- 6.4 Above 3 tons
Chapter 7 Market Estimates & Forecast, By Vehicle Class, 2022 - 2035 ($Bn, Units)
- 7.1 Key trends
- 7.2 Light vans (Class 1-2)
- 7.3 Medium vans (Class 3)
- 7.4 Heavy/step vans (Class 4-6)
Chapter 8 Market Estimates & Forecast, By Wheelbase & Size, 2022 - 2035 ($Bn, Units)
- 8.1 Key trends
- 8.2 Compact (wheelbase <120 inches)
- 8.3 Standard (120-140 inches)
- 8.4 Extended (140-160 inches)
- 8.5 Extra-long (>160 inches)
Chapter 9 Market Estimates & Forecast, By Commercial End Use, 2022 - 2035 ($Bn, Units)
- 9.1 Key trends
- 9.2 Last-mile delivery
- 9.3 Courier/parcel
- 9.4 Field services
- 9.5 Others
Chapter 10 Market Estimates & Forecast, By Sales Channel, 2022 - 2035 ($Bn, Units)
- 10.1 Key trends
- 10.2 OEM
- 10.3 Authorized dealership networks
Chapter 11 Market Estimates & Forecast, By Region, 2022 - 2035 ($Bn, Units)
- 11.1 Key trends
- 11.2 North America
- 11.2.1 US
- 11.2.2 Canada
- 11.3 Europe
- 11.3.1 Germany
- 11.3.2 UK
- 11.3.3 France
- 11.3.4 Italy
- 11.3.5 Spain
- 11.3.6 Russia
- 11.3.7 Nordics
- 11.3.8 Netherlands
- 11.3.9 Sweden
- 11.4 Asia Pacific
- 11.4.1 China
- 11.4.2 India
- 11.4.3 Japan
- 11.4.4 Australia
- 11.4.5 South Korea
- 11.4.6 Singapore
- 11.4.7 Thailand
- 11.4.8 Indonesia
- 11.4.9 Vietnam
- 11.5 Latin America
- 11.5.1 Brazil
- 11.5.2 Mexico
- 11.5.3 Argentina
- 11.6 MEA
- 11.6.1 South Africa
- 11.6.2 Saudi Arabia
- 11.6.3 UAE
- 11.6.4 Turkey
Chapter 12 Company Profiles
- 12.1 Global Players
- 12.1.1 Ford
- 12.1.2 General Motors
- 12.1.3 Hyundai/Kia
- 12.1.4 Mercedes-Benz Vans
- 12.1.5 Nissan
- 12.1.6 Renault Group
- 12.1.7 SAIC
- 12.1.8 Stellantis
- 12.1.9 Toyota
- 12.1.10 Volkswagen
- 12.2 Regional Players
- 12.2.1 BYD
- 12.2.2 Changan Automobile
- 12.2.3 Dongfeng Motor Corporation
- 12.2.4 GAC Group
- 12.2.5 Isuzu Motors
- 12.2.6 Iveco
- 12.3 Emerging Players / Disruptors
- 12.3.1 Arrival
- 12.3.2 Greenkraft
- 12.3.3 Rivian
- 12.3.4 Workhorse Group