


|
시장보고서
상품코드
1666986
LNG 터미널 시장 : 기회, 성장 촉진요인, 산업 동향 분석(2025-2034년)LNG Terminal Market Opportunity, Growth Drivers, Industry Trend Analysis, and Forecast 2025 - 2034 |
||||||
세계의 LNG 터미널 시장은 2024년에 79억 달러로 평가되었고, 2025년부터 2034년에 걸쳐 13.9%의 연평균 성장률(CAGR)로 견조하게 성장할 것으로 예측됩니다.
청정 에너지원으로의 전환과 세계적인 석탄 및 석유 사용량 감소로 인해 천연가스 소비가 크게 증가했습니다. 천연가스는 효율성과 환경 영향이 적은 것으로 인정받으며 선호되는 에너지 대안으로 자리 잡았습니다. 온실가스와 오염 물질을 적게 배출하면서 더 깨끗하게 연소하는 천연가스의 능력은 지속 가능한 에너지 솔루션에 대한 전 세계적인 관심 증가와 맞닿아 있습니다. LNG 인프라의 기술 발전도 시장 성장을 촉진하여 운영을 더욱 효율적으로 만들고 프로젝트 비용을 절감하고 있습니다. 극저온 저장 및 액화 공정의 발전과 같은 주요 혁신은 LNG 프로젝트의 경제성을 향상시켜 시장 채택을 꾸준히 증가시키고 있습니다.
육상 LNG 터미널 부문은 비용 효율적이고 기술적으로 진보된 솔루션을 추구함에 따라 2034년까지 300억 달러를 초과할 것으로 예상됩니다. 향상된 액화 방법, 현대화된 저장 시스템, 간소화된 재기화 프로세스가 운영 환경을 변화시키고 있습니다. 더 작고 현지화된 터미널의 개발은 산업 및 원격 애플리케이션의 특정 에너지 수요를 충족하여 더 광범위한 에너지 접근성을 지원하고 있습니다. 이러한 발전은 저탄소 에너지 시스템으로의 전환에 있어 육상 터미널의 역할을 가속화하여 안정적이고 지속 가능한 에너지 공급을 보장하고 있습니다.
| 시장 범위 | |
|---|---|
| 시작 연도 | 2024년 |
| 예측 연도 | 2025-2034년 |
| 시작 금액 | 79억 달러 |
| 예측 금액 | 320억 달러 |
| CAGR | 13.9% |
동시에 부유식 LNG 터미널 시장은 유연성과 비용 효율성으로 인해 상당한 모멘텀을 경험하고 있습니다. 해상에서 운영하도록 설계된 부유식 터미널은 이동성을 제공하며 광범위한 육상 인프라가 필요하지 않습니다. 이러한 터미널은 기술 발전의 혜택을 받아 안전성과 운영 효율성을 개선하고 있습니다. 액화 능력 향상, 에너지 사용량 감소, 메탄 배출을 완화하는 혁신으로 인해 발전하는 에너지 시장에서 더욱 강력한 발판을 마련할 수 있게 되었습니다.
미국의 LNG 터미널 시장은 2034년까지 170억 달러를 넘어설 것으로 예상됩니다. 국내외에서 청정 에너지에 대한 수요가 증가함에 따라 첨단 터미널 인프라에 대한 투자가 활발해지고 있습니다. 최첨단 액화 및 저장 시스템을 갖춘 업그레이드된 시설은 효율성을 높이는 동시에 운영 비용을 절감하고 있습니다. 또한 업계가 친환경 기술 및 배출량 감축 전략을 채택하는 데 주력하면서 보다 지속 가능한 에너지 프레임워크가 형성되고 있습니다. 이러한 발전은 에너지 소비 증가와 환경을 고려한 솔루션으로의 전환과 맞물려 미국이 글로벌 LNG 환경에서 핵심 플레이어로 자리매김하고 있습니다.
목차
제1장 조사 방법과 조사 범위
- 시장의 정의
- 기본 추정과 계산
- 예측 계산
- 데이터 소스
- 1차 데이터
- 2차 데이터
- 유상
- 공적
제2장 주요 요약
제3장 업계 인사이트
- 생태계 분석
- 규제 상황
- 업계에 미치는 영향요인
- 성장 촉진요인
- 업계의 잠재적 위험 및 과제
- 성장 가능성 분석
- Porter's Five Forces 분석
- 공급기업의 협상력
- 구매자의 협상력
- 신규 참가업체의 위협
- 대체품의 위협
- PESTEL 분석
제4장 경쟁 구도
- 소개
- 전략 대시보드
- 혁신과 지속가능성의 전망
제5장 시장 규모와 예측 : 터미널별(2021-2034년)
- 주요 동향
- 육상
- 부유식
제6장 시장 규모와 예측 : 지역별(2021-2034년)
- 주요 동향
- 북미
- 미국
- 캐나다
- 멕시코
- 유럽
- 영국
- 프랑스
- 네덜란드
- 스페인
- 폴란드
- 러시아
- 이탈리아
- 아시아태평양
- 중국
- 인도
- 일본
- 한국
- 호주
- 태국
- 말레이시아
- 인도네시아
- 중동 및 아프리카
- UAE
- 카타르
- 오만
- 알제리
- 이집트
- 라틴아메리카
- 브라질
- 아르헨티나
제7장 기업 프로파일
- ADNOC
- AES
- BP
- Chevron
- CNPC
- Engas
- Engie
- Eni
- Equinor
- ExxonMobil
- Gazprom
- KNPC
- Pertamina
- Petronas
- Petronet
- Qatar Energy
- Repsol
- Shell
- Total
- Vopak
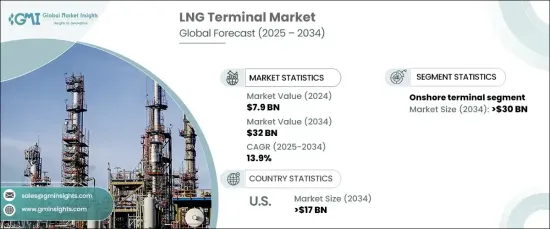
The Global LNG Terminal Market, valued at USD 7.9 billion in 2024, is projected to grow at a robust CAGR of 13.9% from 2025 to 2034. The shift towards cleaner energy sources and the global decline in coal and oil usage has significantly boosted the consumption of natural gas. Recognized for its efficiency and lower environmental impact, natural gas has become a preferred energy alternative. Its ability to burn more cleanly while releasing fewer greenhouse gases and pollutants aligns with the increasing global focus on sustainable energy solutions. Technological advancements in LNG infrastructure are also propelling market growth, making operations more efficient and reducing project costs. Key innovations, such as advancements in cryogenic storage and liquefaction processes, have enhanced the economic feasibility of LNG projects, ensuring a steady rise in market adoption.

The onshore LNG terminal sector is expected to exceed USD 30 billion by 2034, driven by the pursuit of cost-efficient and technologically advanced solutions. Enhanced liquefaction methods, modernized storage systems, and streamlined regasification processes are transforming the operational landscape. The development of smaller, localized terminals is meeting the specific energy demands of industrial and remote applications, supporting broader energy accessibility. These advancements are accelerating the role of onshore terminals in the shift towards low-carbon energy systems, ensuring reliable and sustainable energy supplies.
| Market Scope | |
|---|---|
| Start Year | 2024 |
| Forecast Year | 2025-2034 |
| Start Value | $7.9 Billion |
| Forecast Value | $32 Billion |
| CAGR | 13.9% |
Simultaneously, the floating LNG terminal market is experiencing substantial momentum due to its flexibility and cost-effectiveness. Floating terminals designed to operate in offshore locations, offer mobility and eliminate the need for extensive onshore infrastructure. These terminals are benefiting from technological progress, improving safety and operational efficiency. Enhanced liquefaction capabilities, lower energy usage, and innovations to mitigate methane emissions are driving their appeal, ensuring a stronger foothold in the evolving energy market.
In the United States, the LNG terminal market is anticipated to surpass USD 17 billion by 2034. Growing demand for cleaner energy at both domestic and international levels is fueling investments in advanced terminal infrastructure. Upgraded facilities with state-of-the-art liquefaction and storage systems are enhancing efficiency while reducing operational costs. Additionally, the industry's focus on adopting eco-friendly technologies and strategies for emissions reduction is shaping a more sustainable energy framework. These advancements, coupled with increasing energy consumption and a transition towards environmentally conscious solutions, are positioning the United States as a key player in the global LNG landscape.
Table of Contents
Chapter 1 Methodology & Scope
- 1.1 Market definitions
- 1.2 Base estimates & calculations
- 1.3 Forecast calculation
- 1.4 Data sources
- 1.4.1 Primary
- 1.4.2 Secondary
- 1.4.2.1 Paid
- 1.4.2.2 Public
Chapter 2 Executive Summary
- 2.1 Industry synopsis, 2021 - 2034
Chapter 3 Industry Insights
- 3.1 Industry ecosystem analysis
- 3.2 Regulatory landscape
- 3.3 Industry impact forces
- 3.3.1 Growth drivers
- 3.3.2 Industry pitfalls & challenges
- 3.4 Growth potential analysis
- 3.5 Porter's analysis
- 3.5.1 Bargaining power of suppliers
- 3.5.2 Bargaining power of buyers
- 3.5.3 Threat of new entrants
- 3.5.4 Threat of substitutes
- 3.6 PESTEL analysis
Chapter 4 Competitive Landscape, 2024
- 4.1 Introduction
- 4.2 Strategic dashboard
- 4.3 Innovation & sustainability landscape
Chapter 5 Market Size and Forecast, By Terminal, 2021 – 2034 (MTPA, USD Million)
- 5.1 Key trends
- 5.2 Onshore
- 5.3 Floating
Chapter 6 Market Size and Forecast, By Region, 2021 – 2034 (MTPA, USD Million)
- 6.1 Key trends
- 6.2 North America
- 6.2.1 U.S.
- 6.2.2 Canada
- 6.2.3 Mexico
- 6.3 Europe
- 6.3.1 UK
- 6.3.2 France
- 6.3.3 Netherlands
- 6.3.4 Spain
- 6.3.5 Poland
- 6.3.6 Russia
- 6.3.7 Italy
- 6.4 Asia Pacific
- 6.4.1 China
- 6.4.2 India
- 6.4.3 Japan
- 6.4.4 South Korea
- 6.4.5 Australia
- 6.4.6 Thailand
- 6.4.7 Malaysia
- 6.4.8 Indonesia
- 6.5 Middle East & Africa
- 6.5.1 UAE
- 6.5.2 Qatar
- 6.5.3 Oman
- 6.5.4 Algeria
- 6.5.5 Egypt
- 6.6 Latin America
- 6.6.1 Brazil
- 6.6.2 Argentina
Chapter 7 Company Profiles
- 7.1 ADNOC
- 7.2 AES
- 7.3 BP
- 7.4 Chevron
- 7.5 CNPC
- 7.6 Engas
- 7.7 Engie
- 7.8 Eni
- 7.9 Equinor
- 7.10 ExxonMobil
- 7.11 Gazprom
- 7.12 KNPC
- 7.13 Pertamina
- 7.14 Petronas
- 7.15 Petronet
- 7.16 Qatar Energy
- 7.17 Repsol
- 7.18 Shell
- 7.19 Total
- 7.20 Vopak


