|
시장보고서
상품코드
1667041
원격무인잠수정 시장 기회, 성장 촉진요인, 산업 동향 분석, 예측(2025-2034년)Remote Operated Vehicle Market Opportunity, Growth Drivers, Industry Trend Analysis, and Forecast 2025 - 2034 |
||||||
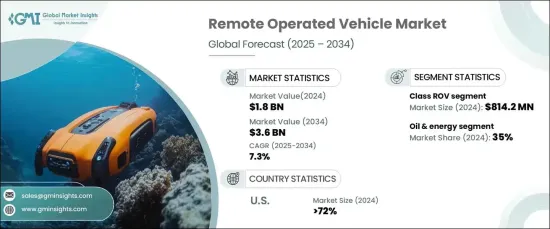
세계 원격무인잠수정 시장은 2024년 18억 달러로 평가되며, 2025년부터 2034년까지 연평균 7.3%의 CAGR로 성장할 것으로 예상됩니다.
다양한 산업 분야의 자동화 수요 증가는 ROV의 부상에 직접적으로 영향을 미치고 있습니다. ROV는 석유 및 가스, 해양 조사, 방위, 인프라 검사 등 위험하거나 접근하기 어려운 환경에서 작업할 때 필수적인 장비로, 높은 정확성, 일관성, 안전성이 요구되는 복잡한 작업을 수행하도록 설계되어 위험한 환경에서 사람의 개입을 최소화할 수 있습니다. 기업이 인건비를 절감하고 안전성을 향상시키려는 노력의 일환으로 ROV를 신뢰할 수 있고 효과적인 솔루션으로 채택하는 추세가 가속화되고 있습니다.

또한, ROV는 실시간 데이터 수집을 통해 작업 효율성을 높이고 정확한 의사결정과 위험 감소를 돕습니다. 이러한 장점으로 인해 다양한 분야에서 ROV가 널리 사용되고 있으며, 오늘날의 자동화 된 세계에서 ROV의 중요성이 증가하고 있음을 보여줍니다. 기술, 특히 인공지능(AI) 및 센서 시스템의 발전은 ROV의 능력을 크게 향상시켰으며, AI는 이러한 차량이 실시간으로 데이터를 처리하고, 이미지를 인식하고, 복잡한 수중 환경을 자율적으로 탐색할 수 있도록 돕습니다. 머신러닝의 통합으로 ROV는 과거 작업으로부터 학습하여 효율성을 향상시킬 수 있으며, 첨단 센서는 데이터 정확도를 향상시키고 구조물 모니터링 및 해양 생물 다양성 조사와 같은 고급 응용 분야에서 ROV의 역할을 확장하고 있습니다.
| 시장 범위 | |
|---|---|
| 시작 연도 | 2024년 |
| 예측 연도 | 2025-2034년 |
| 시작 금액 | 18억 달러 |
| 예상 금액 | 36억 달러 |
| CAGR | 7.3% |
ROV는 원격지 및 수중 환경에서 효율적이고 일관된 작업을 위해 점점 더 많이 사용되고 있으며, 해양 에너지, 해양 인프라, 해저 채굴 등의 산업에서 점검, 유지보수, 수리 작업에 ROV가 활용되고 있습니다. 안전이나 수심에 제한이 있는 사람이 조작하는 시스템과 달리 ROV는 연속 가동이 가능하기 때문에 다운타임을 줄이고 중요한 작업을 차질 없이 수행할 수 있습니다.
시장은 성장하고 있으며, 엄격한 규제 및 운영 요건과 같은 도전에 직면해 있습니다. 기업들은 해양 활동, 환경 보호, 안전에 관한 다양한 지역 및 국제 규정을 준수해야 하며, 안전 조치 및 규정 준수 절차에 많은 투자를 해야 합니다. 특히 석유 및 가스 분야에서는 환경 파괴를 방지하고 ROV 작업 중 안전을 보장하기 위한 엄격한 규제가 적용됩니다.
시장은 작업용 ROV, 경작업용 ROV, 관측용 ROV, 마이크로/미니 ROV 등 여러 ROV 유형으로 나뉘며, 2024년 기준 작업용 ROV 부문의 시장 규모는 8억 1,420만 달러에 달합니다. 자동화와 AI의 통합은 작업용 ROV를 변화시켜 반복적인 작업을 자율적으로 처리할 수 있도록함으로써 작업 효율성을 높이고 있습니다.
용도별로는 석유 및 에너지 분야가 2024년 시장 점유율의 35%를 차지했습니다. ROV는 해양 석유 및 가스 산업에서 해저 작업에 필수적이며, 파이프라인 및 기타 해저 인프라의 설치, 검사 및 유지보수와 같은 중요한 작업을 수행합니다. ROV 기술의 지속적인 발전으로 심해 탐사에서 ROV의 역할은 점점 더 커지고 있습니다.
미국에서는 ROV가 2024년 전체 시장 수익의 72%를 차지했습니다. 해양 석유 및 가스 산업의 수요가 이러한 성장의 주요 원동력이며, ROV는 심해 작업에서 중요한 역할을 하고 있습니다. 또한, 해상 풍력에너지 분야의 확장은 이 지역에서 ROV의 채택을 더욱 촉진하고 있습니다.
목차
제1장 조사 방법과 조사 범위
- 조사 설계
- 조사 접근법
- 데이터 수집 방법
- 기본 추정과 계산
- 기준 연도 산출
- 시장 추정의 주요 동향
- 예측 모델
- 1차 조사와 검증
- 1차 정보
- 데이터 마이닝 소스
- 시장 정의
제2장 주요 요약
제3장 업계 인사이트
- 생태계 분석
- 공급업체 상황
- 원자재 공급업체
- 부품 공급업체
- 제조업체
- 서비스·프로바이더
- 판매업체
- 최종 용도
- 이익률 분석
- 비용 내역 분석
- 테크놀러지와 혁신 전망
- 주요 뉴스와 대처
- 규제 상황
- 영향요인
- 성장 촉진요인
- 전 산업의 자동화 진전
- 테크놀러지와 AI 혁신
- 효율적인 배송 솔루션에 대한 수요
- 지속가능성에 대한 대처와 환경에 대한 관심 상승
- 업계의 잠재적 리스크와 과제
- 과제와 규제 허들
- 높은 유지보수 비용
- 성장 촉진요인
- 성장 가능성 분석
- Porters 분석
- PESTEL 분석
제4장 경쟁 구도
- 소개
- 기업 점유율 분석
- 경쟁 포지셔닝 매트릭스
- 전략 전망 매트릭스
제5장 시장 추정과 예측 : 클래스별, 2021-2034년
- 주요 동향
- 작업 클래스 ROV
- 경작업 클래스 ROV
- 관측 클래스 ROV
- 마이크로/미니 ROV
제6장 시장 추정과 예측 : 용도별, 2021-2034년
- 주요 동향
- 수산양식
- 상업·솔베이지 다이빙
- 자치체 인프라
- 군사
- 석유·에너지
- 기타
제7장 시장 추정과 예측 : 지역별, 2021-2034년
- 주요 동향
- 북미
- 미국
- 캐나다
- 유럽
- 영국
- 독일
- 프랑스
- 이탈리아
- 스페인
- 러시아
- 네덜란드
- 북유럽
- 아시아태평양
- 중국
- 인도
- 일본
- 한국
- 호주
- 동남아시아
- 라틴아메리카
- 브라질
- 아르헨티나
- 멕시코
- 중동 및 아프리카
- UAE
- 사우디아라비아
- 남아프리카공화국
제8장 기업 개요
- AC-CESS Co UK Ltd
- Deep Ocean Group
- DOF Subsea
- Forum Energy Technologies
- Fugro
- i-Tech 7
- Kongsberg Maritime
- Oceaneering International
- ROVOP
- Saab Seaeye
- SEAMOR
- Seatronics
- Subsea 7
- TechnipFMC
- VideoRay
The Global Remote Operated Vehicle Market was valued at USD 1.8 billion in 2024 and is projected to grow at a CAGR of 7.3% from 2025 to 2034. The increasing demand for automation in various industries is directly fueling the rise of ROVs. These vehicles are crucial for tasks in hazardous or hard-to-reach environments, such as those found in oil and gas, marine research, defense, and infrastructure inspection. ROVs are designed to carry out complex operations that require high precision, consistency, and safety, minimizing the need for human intervention in dangerous settings. With companies aiming to reduce labor costs and enhance safety, the adoption of ROVs is accelerating as a reliable and effective solution.
Furthermore, ROVs offer operational efficiency by providing real-time data collection, which aids in accurate decision-making and risk mitigation. These benefits are driving the widespread use of ROVs across diverse sectors, showcasing their growing importance in today's automated world. The advancement of technology, particularly artificial intelligence (AI) and sensor systems, is significantly enhancing ROV capabilities. AI helps these vehicles process data in real-time, recognize images, and autonomously navigate complex underwater environments. The integration of machine learning allows ROVs to improve efficiency through learning from past tasks, while advanced sensors offer improved data accuracy, expanding their role in sophisticated applications such as structural monitoring and marine biodiversity studies.
| Market Scope | |
|---|---|
| Start Year | 2024 |
| Forecast Year | 2025-2034 |
| Start Value | $1.8 Billion |
| Forecast Value | $3.6 Billion |
| CAGR | 7.3% |
ROVs are increasingly relied upon for efficient and consistent operations in remote or underwater environments, with industries like offshore energy, marine infrastructure, and underwater mining depending on them for inspection, maintenance, and repair tasks. Unlike human-operated systems that are limited by safety and depth, ROVs can operate continuously, reducing downtime and ensuring critical operations are carried out without delay.
Despite their growth, the market faces challenges, including stringent regulatory and operational requirements. Companies must comply with various regional and international regulations regarding marine activities, environmental protection, and safety, which require significant investments in safety measures and compliance procedures. The oil and gas sector, in particular, is subject to strict regulations to prevent environmental damage and ensure safety during ROV operations.
The market is divided into several ROV types, including work-class ROVs, light work-class ROVs, observation-class ROVs, and micro/mini ROVs. As of 2024, the work-class ROV segment was valued at USD 814.2 million. Automation and AI integration are transforming the work-class ROVs, enabling them to handle repetitive tasks autonomously, thereby enhancing operational efficiency.
In terms of application, the oil and energy sector accounted for 35% of the market share in 2024. ROVs are indispensable for subsea operations in the offshore oil and gas industry, performing critical tasks like installation, inspection, and maintenance of pipelines and other subsea infrastructure. The continuous improvement of ROV technology, including depth ratings and payload capacity, ensures their growing role in deepwater exploration.
In the U.S., ROVs accounted for 72% of the total market revenue in 2024. The demand in the offshore oil and gas industry is a key driver of this growth, with ROVs playing a vital role in deepwater operations. Additionally, the expanding offshore wind energy sector further boosts ROV adoption in the region.
Table of Contents
Chapter 1 Methodology & Scope
- 1.1 Research design
- 1.1.1 Research approach
- 1.1.2 Data collection methods
- 1.2 Base estimates and calculations
- 1.2.1 Base year calculation
- 1.2.2 Key trends for market estimates
- 1.3 Forecast model
- 1.4 Primary research & validation
- 1.4.1 Primary sources
- 1.4.2 Data mining sources
- 1.5 Market definitions
Chapter 2 Executive Summary
- 2.1 Industry 3600 synopsis, 2021 - 2034
Chapter 3 Industry Insights
- 3.1 Industry ecosystem analysis
- 3.2 Supplier landscape
- 3.2.1 Raw material supplier
- 3.2.2 Component supplier
- 3.2.3 Manufacturer
- 3.2.4 Service provider
- 3.2.5 Distributor
- 3.2.6 End use
- 3.3 Profit margin analysis
- 3.4 Cost breakdown analysis
- 3.5 Technology & innovation landscape
- 3.6 Key news & initiatives
- 3.7 Regulatory landscape
- 3.8 Impact forces
- 3.8.1 Growth drivers
- 3.8.1.1 Rise in automation across industries
- 3.8.1.2 Innovation in technology and AI
- 3.8.1.3 Demand for efficient delivery solution
- 3.8.1.4 Growing sustainability initiatives and environmental concerns
- 3.8.2 Industry pitfalls & challenges
- 3.8.2.1 Challenges and regulatory hurdles
- 3.8.2.2 High cost of maintenance
- 3.8.1 Growth drivers
- 3.9 Growth potential analysis
- 3.10 Porter’s analysis
- 3.11 PESTEL analysis
Chapter 4 Competitive Landscape, 2024
- 4.1 Introduction
- 4.2 Company market share analysis
- 4.3 Competitive positioning matrix
- 4.4 Strategic outlook matrix
Chapter 5 Market Estimates & Forecast, By Class , 2021 - 2034 ($Mn, Units)
- 5.1 Key trends
- 5.2 Work class ROV
- 5.3 Light work class ROV
- 5.4 Observation class ROV
- 5.5 Micro/mini ROV
Chapter 6 Market Estimates & Forecast, By Application, 2021 - 2034 ($Mn, Units)
- 6.1 Key trends
- 6.2 Aquaculture
- 6.3 Commercial & salvage diving
- 6.4 Municipal infrastructure
- 6.5 Military
- 6.6 Oil & energy
- 6.7 Others
Chapter 7 Market Estimates & Forecast, By Region, 2021 - 2034 ($Mn, Units)
- 7.1 Key trends
- 7.2 North America
- 7.2.1 U.S.
- 7.2.2 Canada
- 7.3 Europe
- 7.3.1 UK
- 7.3.2 Germany
- 7.3.3 France
- 7.3.4 Italy
- 7.3.5 Spain
- 7.3.6 Russia
- 7.3.7 Netherlands
- 7.3.8 Nordics
- 7.4 Asia Pacific
- 7.4.1 China
- 7.4.2 India
- 7.4.3 Japan
- 7.4.4 South Korea
- 7.4.5 Australia
- 7.4.6 Southeast Asia
- 7.5 Latin America
- 7.5.1 Brazil
- 7.5.2 Argentina
- 7.5.3 Mexico
- 7.6 MEA
- 7.6.1 UAE
- 7.6.2 Saudi Arabia
- 7.6.3 South Africa
Chapter 8 Company Profiles
- 8.1 AC-CESS Co UK Ltd
- 8.2 Deep Ocean Group
- 8.3 DOF Subsea
- 8.4 Forum Energy Technologies
- 8.5 Fugro
- 8.6 i-Tech 7
- 8.7 Kongsberg Maritime
- 8.8 Oceaneering International
- 8.9 ROVOP
- 8.10 Saab Seaeye
- 8.11 SEAMOR
- 8.12 Seatronics
- 8.13 Subsea 7
- 8.14 TechnipFMC
- 8.15 VideoRay