|
시장보고서
상품코드
1667049
재고 관리 소프트웨어 시장 기회, 성장 촉진요인, 산업 동향 분석, 예측(2025-2034년)Inventory Management Software Market Opportunity, Growth Drivers, Industry Trend Analysis, and Forecast 2025 - 2034 |
||||||
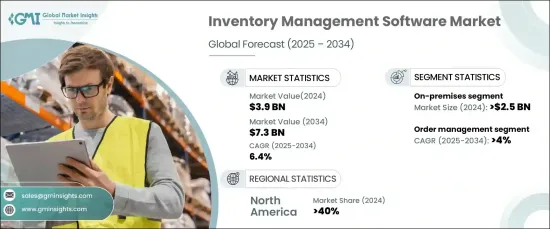
세계 재고 관리 소프트웨어 시장은 2024년 39억 달러 규모로 2025년부터 2034년까지 6.4%의 연평균 성장률(CAGR)을 기록하며 큰 폭의 성장이 예상됩니다. 이러한 견조한 성장에는 업무 효율성 향상, 재고 수준의 실시간 가시성, 복잡해지는 현대의 공급망 관리 솔루션에 대한 니즈가 증가하고 있는 것이 주요 요인으로 작용하고 있습니다. 각 산업 분야의 기업들은 업무 간소화, 비용 절감, 종합적인 데이터 인사이트를 통한 의사결정 개선을 위해 첨단 재고 관리 툴을 빠르게 도입하고 있습니다. 경쟁이 치열해짐에 따라 기업들은 이러한 기술을 활용하여 시장 수요와 고객의 기대에 빠르게 대응하고, 경쟁에서 앞서 나가기 위해 이러한 기술을 활용하고 있습니다.

이 소프트웨어는 향상된 재고 추적, 원활한 주문 처리, 상세한 분석 및 보고 기능 등 많은 이점을 제공합니다. 수동 프로세스를 자동화하고 실용적인 인사이트를 제공함으로써 재고 관리 도구는 재고 수준을 최적화하고 낭비를 줄이며 고객 만족도를 높일 수 있도록 도와줍니다. 이러한 솔루션은 소매, 제조, 물류 등 효과적인 재고 관리가 비즈니스 성공과 고객 충성도에 필수적인 분야에서 특히 중요합니다.
| 시장 범위 | |
|---|---|
| 시작 연도 | 2024년 |
| 예측 연도 | 2025-2034년 |
| 시작 금액 | 39억 달러 |
| 예상 금액 | 73억 달러 |
| CAGR | 6.4% |
이 시장은 주로 온프레미스 및 클라우드 기반 솔루션이라는 도입 모델로 구분되며, 2024년에는 온프레미스형 솔루션이 25억 달러로 가장 큰 비중을 차지했습니다. 기업들은 강력한 보안과 기밀 데이터에 대한 높은 관리성으로 인해 이 모델을 선호합니다. 특히 컴플라이언스 기준이 까다로운 산업 분야의 기업이나 독점 데이터 및 미션 크리티컬한 데이터를 관리하는 기업에게 특히 매력적인 선택입니다. 소매업과 제조업의 경우, 온프레미스 시스템은 주문 관리를 강화하고 원활한 운영을 유지하는 데 필요한 정확한 재고 관리를 가능하게 해줍니다.
재고 관리 소프트웨어는 주문 관리, 자산 추적, 서비스 관리, 제품 차별화, 재고 최적화 등 다양한 분야에서 활용되고 있습니다. 주문 관리 분야는 효율적인 주문 처리 및 이행에 대한 중요성이 부각되면서 2025년부터 2034년까지 CAGR 4%로 성장할 것으로 예측됩니다. 이러한 솔루션은 재고 수준에 대한 가시성을 향상시켜 보충 및 주문 할당에 대한 정보에 입각한 의사결정을 가능하게 합니다. 이를 통해 비즈니스 워크플로우를 최적화하고 고객 서비스 및 고객 만족도를 향상시켜 오늘날의 급변하는 시장에서 경쟁 우위를 확보할 수 있습니다.
북미는 2024년 재고 관리 소프트웨어 시장을 주도하며 전 세계 점유율의 40%를 차지했습니다. 이 지역의 우위는 소매업, 제조업 등 산업 전반에 걸쳐 첨단 기술 솔루션에 대한 수요가 높기 때문으로 분석됩니다. 특히 클라우드 기반 시스템의 채택이 확대되고 있다는 점이 주목할 만합니다. 이러한 플랫폼은 재고에 대한 가시성을 높이고, 데이터 기반 의사결정을 가능하게 하며, 공급망 관리를 간소화할 수 있기 때문입니다. 북미 기업들은 프로세스 자동화, 오류 감소, 진화하는 시장 요구에 대한 적응, 장기적인 성장과 수익성 확보를 위해 이러한 툴을 점점 더 많이 활용하고 있습니다.
목차
제1장 조사 방법과 조사 범위
- 조사 설계
- 조사 접근법
- 데이터 수집 방법
- 기본 추정과 계산
- 기준 연도 산출
- 시장 추정의 주요 동향
- 예측 모델
- 1차 조사와 검증
- 1차 정보
- 데이터 마이닝 소스
- 시장 범위와 정의
제2장 주요 요약
제3장 업계 인사이트
- 생태계 분석
- 공급업체 상황
- 소프트웨어 프로바이더
- 클라우드 서비스 프로바이더
- 시스템 통합사업자
- 최종 용도
- 이익률 분석
- 테크놀러지와 혁신 전망
- 특허 분석
- 규제 상황
- 재고 관리 소프트웨어의 진화
- 재고 관리와 창고 관리의 비교 분석
- 영향요인
- 성장 촉진요인
- 옴니채널 소매 채용 증가
- RFID 기술에 대한 수요 상승
- 스마트폰이나 모바일 기기 보급
- E-Commerce의 인기 급상승
- 업계의 잠재적 리스크와 과제
- 소프트웨어 도입에 따른 고비용
- 새로운 소프트웨어와 레거시 시스템의 통합
- 성장 촉진요인
- 성장 가능성 분석
- Porters 분석
- PESTEL 분석
제4장 경쟁 구도
- 소개
- 기업 점유율 분석
- 경쟁 포지셔닝 매트릭스
- 전략 전망 매트릭스
제5장 시장 추정과 예측 : 솔루션별, 2021-2034년
- 주요 동향
- 수동 재고 관리 시스템
- 바코드 스캔 시스템
- 고도 무선주파수 시스템
제6장 시장 추정과 예측 : 전개 모델별, 2021-2034년
- 주요 동향
- 온프레미스
- 클라우드
제7장 시장 추정과 예측 : 조직 규모별, 2021-2034년
- 주요 동향
- 중소기업
- 대기업
제8장 시장 추정과 예측 : 용도별, 2021-2034년
- 주요 동향
- 오더 관리
- 자산 추적
- 서비스 관리
- 제품 차별화
- 재고 최적화
제9장 시장 추정과 예측 : 최종 용도별, 2021-2034년
- 주요 동향
- 제조업
- 헬스케어
- 소매
- 자동차
- 석유 및 가스
- 기타
제10장 시장 추정과 예측 : 지역별, 2021-2034년
- 주요 동향
- 북미
- 미국
- 캐나다
- 유럽
- 영국
- 독일
- 프랑스
- 이탈리아
- 스페인
- 네덜란드
- 아시아태평양
- 중국
- 인도
- 일본
- 호주
- 한국
- 동남아시아
- 라틴아메리카
- 브라질
- 멕시코
- 아르헨티나
- 중동 및 아프리카
- UAE
- 남아프리카공화국
- 사우디아라비아
제11장 기업 개요
- Alterity
- Archon Systems
- Blue Yonder Group
- Cin7
- Clear Spider
- Fishbowl Inventory
- International Business Machines(IBM)
- Intuit
- Lightspeed Venture Partners
- Manhattan Associates
- Microsoft
- Monday.com
- NCR
- Oracle
- Revel Systems
- Sage
- SAP SE
- SkuVault(Marlin Equity Partners)
- Wasp Barcode
- Zoho
The Global Inventory Management Software Market, valued at USD 3.9 billion in 2024, is poised for significant growth, with a projected CAGR of 6.4% from 2025 to 2034. This robust expansion is fueled by the increasing need for operational efficiency, real-time visibility into inventory levels, and solutions to manage the growing complexity of modern supply chains. Businesses across industries are rapidly adopting advanced inventory management tools to streamline operations, cut costs, and improve decision-making through comprehensive data insights. As competition intensifies, organizations are leveraging these technologies to stay ahead, ensuring they can adapt quickly to fluctuating market demands and customer expectations.
This software delivers a host of benefits, including enhanced inventory tracking, seamless order fulfillment, and in-depth analytics and reporting capabilities. By automating manual processes and providing actionable insights, inventory management tools help businesses optimize stock levels, reduce waste, and improve customer satisfaction. These solutions are particularly vital in sectors such as retail, manufacturing, and logistics, where effective inventory control is critical for operational success and customer loyalty.
| Market Scope | |
|---|---|
| Start Year | 2024 |
| Forecast Year | 2025-2034 |
| Start Value | $3.9 Billion |
| Forecast Value | $7.3 Billion |
| CAGR | 6.4% |
The market is segmented by deployment models, primarily on-premises and cloud-based solutions. In 2024, the on-premises segment commanded a significant share, valued at USD 2.5 billion. Businesses favor this model for its robust security and greater control over sensitive data. This option is especially appealing to organizations in industries with stringent compliance standards or those managing proprietary or mission-critical data. For retail and manufacturing companies, on-premises systems provide the precise inventory control needed to enhance order management and maintain smooth operations.
Applications of inventory management software span several areas, including order management, asset tracking, service management, product differentiation, and inventory optimization. The order management segment is anticipated to grow at a CAGR of 4% between 2025 and 2034, driven by the increasing emphasis on efficient order processing and fulfillment. These solutions offer businesses improved visibility into inventory levels, enabling informed decisions about restocking and order allocation. This not only optimizes operational workflows but also boosts customer service and satisfaction, giving businesses a competitive edge in today's fast-paced marketplace.
North America led the inventory management software market in 2024, accounting for 40% of the global share. The region's dominance stems from a high demand for advanced technological solutions across industries like retail and manufacturing. The growing adoption of cloud-based systems is particularly notable, as these platforms enhance inventory visibility, enable data-driven decision-making, and streamline supply chain management. Companies in North America are increasingly leveraging these tools to automate processes, reduce errors, and adapt to evolving market needs, ensuring long-term growth and profitability.
Table of Contents
Chapter 1 Methodology & Scope
- 1.1 Research design
- 1.1.1 Research approach
- 1.1.2 Data collection methods
- 1.2 Base estimates & calculations
- 1.2.1 Base year calculation
- 1.2.2 Key trends for market estimation
- 1.3 Forecast model
- 1.4 Primary research and validation
- 1.4.1 Primary sources
- 1.4.2 Data mining sources
- 1.5 Market scope & definition
Chapter 2 Executive Summary
- 2.1 Industry 3600 synopsis, 2021 - 2034
Chapter 3 Industry Insights
- 3.1 Industry ecosystem analysis
- 3.2 Supplier landscape
- 3.2.1 Software providers
- 3.2.2 Cloud service providers
- 3.2.3 System integrators
- 3.2.4 End use
- 3.3 Profit margin analysis
- 3.4 Technology & innovation landscape
- 3.5 Patent analysis
- 3.6 Regulatory landscape
- 3.7 Inventory management software evolution
- 3.8 Analysis of inventory management vs. warehouse management
- 3.9 Impact forces
- 3.9.1 Growth drivers
- 3.9.1.1 Rising adoption of omnichannel retailing
- 3.9.1.2 Growing demand for RFID technology
- 3.9.1.3 Proliferation of smartphones and mobile devices
- 3.9.1.4 Surge in e-commerce popularity
- 3.9.2 Industry pitfalls & challenges
- 3.9.2.1 High costs associated with software implementation
- 3.9.2.2 Integration of new software with legacy systems
- 3.9.1 Growth drivers
- 3.10 Growth potential analysis
- 3.11 Porter’s analysis
- 3.12 PESTEL analysis
Chapter 4 Competitive Landscape, 2024
- 4.1 Introduction
- 4.2 Company market share analysis
- 4.3 Competitive positioning matrix
- 4.4 Strategic outlook matrix
Chapter 5 Market Estimates & Forecast, By Solution, 2021 - 2034 ($Bn)
- 5.1 Key trends
- 5.2 Manually managed inventory system
- 5.3 Barcode scanning system
- 5.4 Advanced radio frequency system
Chapter 6 Market Estimates & Forecast, By Deployment Model, 2021 - 2034 ($Bn)
- 6.1 Key trends
- 6.2 On-premises
- 6.3 Cloud
Chapter 7 Market Estimates & Forecast, By Organization Size, 2021 - 2034 ($Bn)
- 7.1 Key trends
- 7.2 SME
- 7.3 Large enterprise
Chapter 8 Market Estimates & Forecast, By Application, 2021 - 2034 ($Bn)
- 8.1 Key trends
- 8.2 Order management
- 8.3 Asset tracking
- 8.4 Service management
- 8.5 Product differentiation
- 8.6 Inventory optimization
Chapter 9 Market Estimates & Forecast, By End Use, 2021 - 2034 ($Bn)
- 9.1 Key trends
- 9.2 Manufacturing
- 9.3 Healthcare
- 9.4 Retail
- 9.5 Automotive
- 9.6 Oil & gas
- 9.7 Others
Chapter 10 Market Estimates & Forecast, By Region, 2021 - 2034 ($Bn)
- 10.1 Key trends
- 10.2 North America
- 10.2.1 U.S.
- 10.2.2 Canada
- 10.3 Europe
- 10.3.1 UK
- 10.3.2 Germany
- 10.3.3 France
- 10.3.4 Italy
- 10.3.5 Spain
- 10.3.6 Netherlands
- 10.4 Asia Pacific
- 10.4.1 China
- 10.4.2 India
- 10.4.3 Japan
- 10.4.4 Australia
- 10.4.5 South Korea
- 10.4.6 Southeast Asia
- 10.5 Latin America
- 10.5.1 Brazil
- 10.5.2 Mexico
- 10.5.3 Argentina
- 10.6 MEA
- 10.6.1 UAE
- 10.6.2 South Africa
- 10.6.3 Saudi Arabia
Chapter 11 Company Profiles
- 11.1 Alterity
- 11.2 Archon Systems
- 11.3 Blue Yonder Group
- 11.4 Cin7
- 11.5 Clear Spider
- 11.6 Fishbowl Inventory
- 11.7 International Business Machines (IBM)
- 11.8 Intuit
- 11.9 Lightspeed Venture Partners
- 11.10 Manhattan Associates
- 11.11 Microsoft
- 11.12 Monday.com
- 11.13 NCR
- 11.14 Oracle
- 11.15 Revel Systems
- 11.16 Sage
- 11.17 SAP SE
- 11.18 SkuVault (Marlin Equity Partners)
- 11.19 Wasp Barcode
- 11.20 Zoho