|
시장보고서
상품코드
1667072
고정 촉매 시스템 시장 : 기회, 성장 촉진요인, 산업 동향 분석, 예측(2025-2034년)Stationary Catalytic Systems Market Opportunity, Growth Drivers, Industry Trend Analysis, and Forecast 2025 - 2034 |
||||||
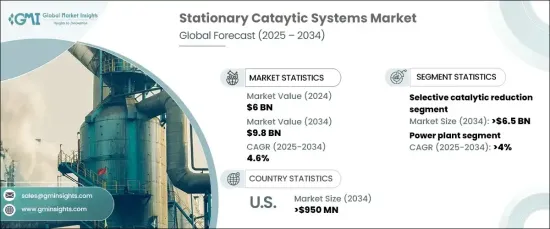
세계의 고정 촉매 시스템 시장 규모는 2024년 60억 달러로 평가되었고 2025년부터 2034년까지 연평균 복합 성장률(CAGR) 4.6%로 확대될 것으로 예측됩니다.
이 성장의 원동력은 에너지 수요 증가, 급속한 산업화, 에너지 효율 규제 강화입니다. 고정 촉매 시스템은 질소 산화물 배출을 줄이고 청정 에너지 목표를 지원하는 능력으로 인해 에너지 집약적 산업에서 점점 더 많이 사용되고 있습니다. 시멘트 생산, 발전소, 금속가공, 제조업 등에서의 채용은 NOx와 CO 배출의 최소화에 초점을 맞춘 정부의 의무화에 의해 추진되고 있습니다.

선택적 촉매 환원(SCR) 분야는 2034년까지 65억 달러 이상에 달할 것으로 예측되어 큰 성장을 이루려고 합니다. SCR 기술은 질소 산화물 감소에 매우 효과적이며 최대 95%의 NOx 배출 감소를 달성합니다. 이러한 시스템은 암모니아 배출량을 허용 한계 내에서 유지하면서 엄격한 규제 기준을 충족하도록 설계되었으며 시장 수요를 높이고 있습니다. 다양한 산업용도에 적합한 비용 효율적인 컴팩트한 설계 등 SCR 기술의 끊임없는 진보가 채용을 더욱 가속화하고 있습니다.
| 시장 범위 | |
|---|---|
| 시작 연도 | 2024 |
| 예측 연도 | 2025-2034년 |
| 시작 금액 | 60억 달러 |
| 예측 금액 | 98억 달러 |
| CAGR | 4.6% |
고정 촉매 시스템의 주요 용도는 발전소이며, 이 부문은 2034년까지 연평균 복합 성장률(CAGR) 4% 이상 성장할 것으로 예상됩니다. 전력 수요가 증가함에 따라 효과적인 산업용 배출 가스 제어가 필요하기 때문에 발전 시설은 이러한 시스템을 통합하는 것이 좋습니다. 유해가스의 배출감소를 의무화하는 규제 프레임워크은 이 분야에서 신뢰성 높은 배출제어기술의 도입을 중시하게 되었습니다.
시멘트 생산 부문은 대기 오염물질의 수준 상승에 따라 배출가스 제어 시스템 수요를 강화하고 있습니다. 엄격한 컴플라이언스 요건과 배출 제한을 초과할 경우 금전적 벌칙의 위험은 SCR 및 산화 촉매와 같은 기술의 중요성을 높여줍니다. 신흥경제국에서는 인프라가 확대되고 건설활동이 활발해지기 때문에 이러한 시스템의 대폭적인 성장이 예상됩니다.
미국의 고정 촉매 시스템 시장은 제조 활동 증가와 석탄 화력 발전소에서 가스 화력 발전소로의 전환에 힘입어 2034년까지 9억 5,000만 달러 이상에 달할 것으로 예측됩니다. NOx와 CO 배출을 위한 환경규제의 강화와 이러한 오염물질이 환경에 미치는 영향에 대한 의식이 높아짐에 따라 시장 성장이 강화되고 있습니다. 산업계가 진화하는 환경정책에 맞추어 보다 깨끗한 기술을 채용함에 따라 고정 촉매 시스템 수요는 대폭 증가할 것으로 보입니다.
목차
제1장 조사 방법과 조사 범위
- 시장의 정의
- 기본 추정과 계산
- 예측 계산
- 데이터 소스
- 1차 데이터
- 2차 데이터
- 유상
- 공적
제2장 주요 요약
제3장 업계 인사이트
- 생태계 분석
- 규제 상황
- 업계에 미치는 영향요인
- 성장 촉진요인
- 업계의 잠재적 위험 및 과제
- 성장 가능성 분석
- Porter's Five Forces 분석
- 공급기업의 협상력
- 구매자의 협상력
- 신규 참가업체의 위협
- 대체품의 위협
- PESTEL 분석
제4장 경쟁 구도
- 서론
- 전략 대시보드
- 혁신과 지속가능성의 전망
제5장 시장 규모와 예측 : 기술별(2021-2034년)
- 선택적 촉매 환원
- 산화 촉매
제6장 시장 규모와 예측 : 용도별(2021-2034년)
- 주요 동향
- 발전 플랜트
- 화학 및 석유화학
- 시멘트
- 금속
- 해양
- 제조
- 기타
제7장 시장 규모와 예측 : 지역별(2021-2034년)
- 주요 동향
- 북미
- 미국
- 캐나다
- 멕시코
- 유럽
- 영국
- 프랑스
- 독일
- 이탈리아
- 스페인
- 러시아
- 아시아태평양
- 중국
- 일본
- 인도
- 한국
- 호주
- 중동 및 아프리카
- 사우디아라비아
- 아랍에미리트(UAE)
- 남아프리카
- 라틴아메리카
- 브라질
- 아르헨티나
제8장 기업 프로파일
- Agriemach
- Babcock &Wilcox
- CECO Environmental
- Cormetech
- DCL International
- Ducon
- Environmental Energy Services
- GE Vernova
- Hug Engineering
- Johnson Matthey
- Kwangsung
- MAN Energy Solutions
- McGill AirClean
- Mitsubishi Heavy Industries
- Thermax
- Yara International
The Global Stationary Catalytic Systems Market was valued at USD 6 billion in 2024 and is projected to expand at a CAGR of 4.6% from 2025 to 2034. This growth is driven by rising energy demands, rapid industrialization, and stricter energy efficiency regulations. Stationary catalytic systems are increasingly used in energy-intensive industries for their ability to reduce nitrogen oxide emissions and support clean energy goals. Their adoption across cement production, power plants, metal processing, and manufacturing industries is being propelled by government mandates focused on minimizing NOx and CO emissions.
The selective catalytic reduction (SCR) segment is poised for significant growth, with projections exceeding USD 6.5 billion by 2034. SCR technology is highly effective in reducing nitrogen oxides, achieving up to 95% NOx emission reduction. These systems are designed to meet stringent regulatory standards while maintaining ammonia emissions within acceptable thresholds, which enhances their market demand. Continuous advancements in SCR technology, including cost-efficient and compact designs suitable for diverse industrial applications, further accelerate adoption.
| Market Scope | |
|---|---|
| Start Year | 2024 |
| Forecast Year | 2025-2034 |
| Start Value | $6 Billion |
| Forecast Value | $9.8 Billion |
| CAGR | 4.6% |
Power plants represent a key application for stationary catalytic systems, with the segment expected to grow at a CAGR of over 4% by 2034. The increasing need for effective industrial emission controls, in line with growing electricity demands, encourages power generation facilities to integrate these systems. Regulatory frameworks mandating reduced emissions of harmful gases have intensified the focus on deploying reliable emission control technologies across this sector.
The cement production sector, along with rising levels of atmospheric pollutants, is also bolstering demand for emission control systems. Strict compliance requirements and the risk of financial penalties for exceeding emission limits have amplified the importance of technologies like SCR and oxidation catalysts. Developing economies, with their expanding infrastructure and growing construction activities, are expected to drive significant growth in these systems.
The U.S. stationary catalytic systems market is projected to surpass USD 950 million by 2034, supported by increasing manufacturing activities and the shift from coal-based power plants to gas-fired facilities. Stricter environmental regulations targeting NOx and CO emissions, along with heightened awareness of the environmental impacts of these pollutants, are strengthening market growth. As industries adopt cleaner technologies to align with evolving environmental policies, the demand for stationary catalytic systems is set to rise substantially.
Table of Contents
Chapter 1 Methodology & Scope
- 1.1 Market definitions
- 1.2 Base estimates & calculations
- 1.3 Forecast calculation
- 1.4 Data sources
- 1.4.1 Primary
- 1.4.2 Secondary
- 1.4.2.1 Paid
- 1.4.2.2 Public
Chapter 2 Executive Summary
- 2.1 Industry synopsis, 2021 - 2034
Chapter 3 Industry Insights
- 3.1 Industry ecosystem analysis
- 3.2 Regulatory landscape
- 3.3 Industry impact forces
- 3.3.1 Growth drivers
- 3.3.2 Industry pitfalls & challenges
- 3.4 Growth potential analysis
- 3.5 Porter's analysis
- 3.5.1 Bargaining power of suppliers
- 3.5.2 Bargaining power of buyers
- 3.5.3 Threat of new entrants
- 3.5.4 Threat of substitutes
- 3.6 PESTEL analysis
Chapter 4 Competitive Landscape, 2024
- 4.1 Introduction
- 4.2 Strategic dashboard
- 4.3 Innovation & sustainability landscape
Chapter 5 Market Size and Forecast, By Technology, 2021 – 2034 (USD Million)
- 5.1 Selective catalytic reduction
- 5.2 Oxidation catalyst
Chapter 6 Market Size and Forecast, By Application, 2021 – 2034 (USD Million)
- 6.1 Key trends
- 6.2 Power plants
- 6.3 Chemical & petrochemical
- 6.4 Cement
- 6.5 Metal
- 6.6 Marine
- 6.7 Manufacturing
- 6.8 Others
Chapter 7 Market Size and Forecast, By Region, 2021 – 2034 (USD Million, ‘000 Units)
- 7.1 Key trends
- 7.2 North America
- 7.2.1 U.S
- 7.2.2 Canada
- 7.2.3 Mexico
- 7.3 Europe
- 7.3.1 UK
- 7.3.2 France
- 7.3.3 Germany
- 7.3.4 Italy
- 7.3.5 Spain
- 7.3.6 Russia
- 7.4 Asia Pacific
- 7.4.1 China
- 7.4.2 Japan
- 7.4.3 India
- 7.4.4 South Korea
- 7.4.5 Australia
- 7.5 Middle East & Africa
- 7.5.1 Saudi Arabia
- 7.5.2 UAE
- 7.5.3 South Africa
- 7.6 Latin America
- 7.6.1 Brazil
- 7.6.2 Argentina
Chapter 8 Company Profiles
- 8.1 Agriemach
- 8.2 Babcock & Wilcox
- 8.3 CECO Environmental
- 8.4 Cormetech
- 8.5 DCL International
- 8.6 Ducon
- 8.7 Environmental Energy Services
- 8.8 GE Vernova
- 8.9 Hug Engineering
- 8.10 Johnson Matthey
- 8.11 Kwangsung
- 8.12 MAN Energy Solutions
- 8.13 McGill AirClean
- 8.14 Mitsubishi Heavy Industries
- 8.15 Thermax
- 8.16 Yara International