|
시장보고서
상품코드
1667114
DC 솔라 케이블 시장 기회, 성장 촉진 요인, 산업 동향 분석, 예측(2025-2034년)DC Solar Cable Market Opportunity, Growth Drivers, Industry Trend Analysis, and Forecast 2025 - 2034 |
||||||
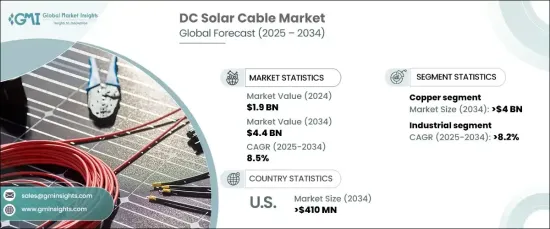
DC 솔라 케이블 세계 시장은 2024년에는 19억 달러로 평가되었으며, 2025년부터 2034년까지 8.5%의 연평균 복합 성장률(CAGR)로 성장할 것으로 예상됩니다.
이 성장의 원동력이 되는 것은 재생가능 에너지로의 세계 전환 증가와 태양광 발전에 대한 집중이 가속화됨에 따라 촉진되고 있습니다. 세계 정부와 산업계가 지속 가능한 에너지 솔루션을 채택하면서 효율적이고 내구성있는 DC 태양 케이블 수요가 급증하고 있습니다. 이 케이블은 태양전지판에서 인버터로의 직류(DC) 전송에 필수적이며 최소한의 에너지 손실과 최적의 성능을 보장합니다. 태양광 발전이 주택, 상업시설 및 유틸리티 규모 용도의 주요 에너지원이 됨에 따라 이러한 시스템을 지원하는 고품질의 오래된 케이블에 대한 필요성이 과거에 증가하고 있습니다. 태양광 발전(PV) 시스템의 인기 증가와 다양한 분야에의 보급이 이 수요 급증의 주요 요인입니다.

구리 도체 분야는 시장을 독점하고 2034년까지 40억 달러를 창출할 것으로 예상됩니다. 구리는 전도성, 열 안정성, 내구성이 우수하기 때문에 PV 시스템의 직류 용도로 선택되는 재료입니다. 구리는 엄격한 환경 조건에서도 에너지 손실을 최소화하고 높은 효율을 유지하는 것으로 알려져 있습니다. 또한 구리는 고열에 견디며 부식에도 강하므로 케이블 수명이 길고 대규모 태양열 장비에 이상적입니다. 대규모 태양광 프로젝트에 대한 수요가 증가함에 따라, 구리 기반 DC 태양광 케이블의 요구는 상승의 길을 따라가고 있습니다. 그 이유는 안정적인 성능과 현대 태양광 에너지 시스템의 까다로운 요구에 부응하는 능력에 있습니다.
| 시장 범위 | |
|---|---|
| 시작연도 | 2024년 |
| 예측연도 | 2025년-2034년 |
| 시작금액 | 19억 달러 |
| 예측 금액 | 44억 달러 |
| CAGR | 8.5% |
산업 부문은 큰 성장이 예상되며 2034년까지 연평균 복합 성장률(CAGR)은 8.2%로 성장할 것으로 예상됩니다. 산업계는 지속가능성 목표를 달성하고 이산화탄소 배출량을 줄이기 위해 태양광 발전을 이용해 왔으며 에너지 비용을 낮추는 장점도 있습니다. 청정에너지에 대한 세액공제와 보조금을 포함한 정부의 우대조치가 산업시설에서 태양광발전시스템의 채용을 가속화하고 있습니다. 산업 환경에서의 태양에너지 이용이 확대됨에 따라 최고의 성능을 유지하면서 고전압 및 전류 레벨을 효율적으로 처리할 수 있는 견고한 DC 태양전지 케이블에 대한 수요도 증가하고 있습니다. 이러한 산업용 태양광 발전 설비에서는 엄격한 조건을 견디고 장기적인 신뢰성을 제공할 수 있는 케이블이 필요하기 때문에 고품질의 DC 태양 케이블이 필수품이 되고 있습니다.
미국에서 DC 태양광 케이블 시장은 2034년까지 4억 1,000만 달러에 이를 것으로 예측됩니다. 주택, 상업시설, 공공시설 규모의 태양광 발전 설비가 급증하고 있는 것이 이 확대를 뒷받침하고 있습니다. 투자세액공제(ITC) 프로그램 등의 연방 및 주에 의한 우대조치로 인해 태양에너지로의 전환이 보다 경제적으로 친숙해지고 있습니다. 또한 미국 정부의 탄소 중립에 대한 헌신과 재생 가능 에너지 인프라에 대한 대규모 투자로 인해 전국적으로 태양광 발전 도입이 가속화되고 있으며 고성능 DC 태양 케이블 수요가 더욱 높아지고 있습니다. 그 결과 미국 시장은 태양에너지가 다양한 분야에서 계속 보급됨에 따라 지속적인 성장이 예상되고 있습니다.
목차
제1장 조사 방법과 조사 범위
- 시장의 정의
- 기본 추정과 계산
- 예측 계산
- 데이터 소스
- 1차
- 2차
- 유상
- 공적
제2장 주요 요약
제3장 업계 인사이트
- 업계 생태계 분석
- 규제 상황
- 업계에 미치는 영향요인
- 성장 촉진요인
- 업계의 잠재적 리스크 및 과제
- 성장 가능성 분석
- Porter's Five Forces 분석
- 공급기업의 협상력
- 구매자의 협상력
- 신규 참가업체의 위협
- 대체품의 위협
- PESTEL 분석
제4장 경쟁 구도
- 전략 대시보드
- 혁신과 지속가능성의 전망
제5장 시장 규모와 예측 : 도체별, 2021년-2034년
- 주요 동향
- 구리
- 알루미늄
- 기타
제6장 시장 규모와 예측 : 용도별, 2021년-2034년
- 주요 동향
- 주택용
- 상업용
- 산업용
제7장 시장 규모와 예측 : 지역별, 2021년-2034년
- 주요 동향
- 북미
- 미국
- 캐나다
- 멕시코
- 유럽
- 영국
- 프랑스
- 독일
- 이탈리아
- 러시아
- 스페인
- 아시아태평양
- 중국
- 호주
- 인도
- 일본
- 한국
- 중동 및 아프리카
- 사우디아라비아
- 아랍에미리트(UAE)
- 터키
- 남아프리카
- 이집트
- 라틴아메리카
- 브라질
- 아르헨티나
제8장 기업 프로파일
- Alpha Wire
- Allied Wire and Cable
- Belden
- Fujikura
- Furukawa Electric
- General Cable
- Havells
- Helukabel
- Hellenic Group
- Kabelwerk Eupen
- KEI Industries
- Lapp Group
- Leoni
- LS Cable and System
- Nexans
- Northwire
- Polycab
- Prysmian Group
- RR Kabel
- Southwire Company
- TE Connectivity
The Global DC Solar Cable Market was valued at USD 1.9 billion in 2024 and is estimated to grow at a robust CAGR of 8.5% from 2025 to 2034. This growth is being fueled by the increasing global shift towards renewable energy and the accelerating focus on solar power. As governments and industries worldwide embrace sustainable energy solutions, the demand for efficient and durable DC solar cables has skyrocketed. These cables are essential for transmitting direct current (DC) from solar panels to inverters, ensuring minimal energy loss and optimal performance. With solar power becoming a leading energy source for residential, commercial, and utility-scale applications, the need for high-quality, long-lasting cables to support these systems is greater than ever. The growing popularity of photovoltaic (PV) systems and their widespread adoption across various sectors are key contributors to this surge in demand.
The copper conductor segment is expected to dominate the market, generating USD 4 billion by 2034. Copper's superior electrical conductivity, thermal stability, and durability make it the material of choice for DC applications within PV systems. It is known for minimizing energy loss and maintaining high efficiency, even under challenging environmental conditions. Furthermore, copper's ability to withstand high heat and resist corrosion ensures a long operational life for these cables, making them ideal for large-scale solar installations. As the demand for expansive solar projects rises, the need for copper-based DC solar cables continues to climb, driven by their reliable performance and ability to meet the rigorous demands of modern solar energy systems.
| Market Scope | |
|---|---|
| Start Year | 2024 |
| Forecast Year | 2025-2034 |
| Start Value | $1.9 Billion |
| Forecast Value | $4.4 Billion |
| CAGR | 8.5% |
The industrial sector is expected to see significant growth, with a projected CAGR of 8.2% through 2034. Industries are increasingly turning to solar power to meet sustainability goals and reduce carbon footprints, with the added benefit of lowering energy costs. Government incentives, including tax credits and subsidies for clean energy, are accelerating the adoption of solar power systems in industrial facilities. As the use of solar energy in industrial settings grows, so too does the demand for robust DC solar cables that can efficiently handle high voltage and current levels while maintaining top performance. These industrial solar installations require cables that can endure challenging conditions and provide long-term reliability, which makes high-quality DC solar cables a necessity.
In the U.S., the DC solar cable market is projected to reach USD 410 million by 2034. The rapid growth in solar installations across residential, commercial, and utility-scale sectors is driving this expansion. Federal and state incentives, such as the Investment Tax Credit (ITC) program, have made the transition to solar energy more financially accessible. In addition, the U.S. government's commitment to carbon neutrality and large-scale investments in renewable energy infrastructure are accelerating the adoption of solar power nationwide, further boosting the demand for high-performance DC solar cables. As a result, the U.S. market is expected to see continued growth as solar energy continues to gain traction across multiple sectors.
Table of Contents
Chapter 1 Methodology & Scope
- 1.1 Market definitions
- 1.2 Base estimates & calculations
- 1.3 Forecast calculation
- 1.4 Data sources
- 1.4.1 Primary
- 1.4.2 Secondary
- 1.4.2.1 Paid
- 1.4.2.2 Public
Chapter 2 Executive Summary
- 2.1 Industry synopsis, 2021 - 2034
Chapter 3 Industry Insights
- 3.1 Industry ecosystem analysis
- 3.2 Regulatory landscape
- 3.3 Industry impact forces
- 3.3.1 Growth drivers
- 3.3.2 Industry pitfalls & challenges
- 3.4 Growth potential analysis
- 3.5 Porter's analysis
- 3.5.1 Bargaining power of suppliers
- 3.5.2 Bargaining power of buyers
- 3.5.3 Threat of new entrants
- 3.5.4 Threat of substitutes
- 3.6 PESTEL analysis
Chapter 4 Competitive landscape, 2024
- 4.1 Strategic dashboard
- 4.2 Innovation & sustainability landscape
Chapter 5 Market Size and Forecast, By Conductor, 2021 – 2034 (USD Million, ‘000 Tonnes)
- 5.1 Key trends
- 5.2 Copper
- 5.3 Aluminum
- 5.4 Others
Chapter 6 Market Size and Forecast, By Application, 2021 – 2034 (USD Million, ‘000 Tonnes)
- 6.1 Key trends
- 6.2 Residential
- 6.3 Commercial
- 6.4 Industrial
Chapter 7 Market Size and Forecast, By Region, 2021 – 2034 (USD Million, ‘000 Tonnes)
- 7.1 Key trends
- 7.2 North America
- 7.2.1 U.S.
- 7.2.2 Canada
- 7.2.3 Mexico
- 7.3 Europe
- 7.3.1 UK
- 7.3.2 France
- 7.3.3 Germany
- 7.3.4 Italy
- 7.3.5 Russia
- 7.3.6 Spain
- 7.4 Asia Pacific
- 7.4.1 China
- 7.4.2 Australia
- 7.4.3 India
- 7.4.4 Japan
- 7.4.5 South Korea
- 7.5 Middle East & Africa
- 7.5.1 Saudi Arabia
- 7.5.2 UAE
- 7.5.3 Turkey
- 7.5.4 South Africa
- 7.5.5 Egypt
- 7.6 Latin America
- 7.6.1 Brazil
- 7.6.2 Argentina
Chapter 8 Company Profiles
- 8.1 Alpha Wire
- 8.2 Allied Wire and Cable
- 8.3 Belden
- 8.4 Fujikura
- 8.5 Furukawa Electric
- 8.6 General Cable
- 8.7 Havells
- 8.8 Helukabel
- 8.9 Hellenic Group
- 8.10 Kabelwerk Eupen
- 8.11 KEI Industries
- 8.12 Lapp Group
- 8.13 Leoni
- 8.14 LS Cable and System
- 8.15 Nexans
- 8.16 Northwire
- 8.17 Polycab
- 8.18 Prysmian Group
- 8.19 RR Kabel
- 8.20 Southwire Company
- 8.21 TE Connectivity