
|
시장보고서
상품코드
1667184
유틸리티 태양광 발전 EPC 시장 : 기회, 성장 촉진요인, 산업 동향 분석(2025-2034년)Utility Solar PV EPC Market Opportunity, Growth Drivers, Industry Trend Analysis, and Forecast 2025 - 2034 |
||||||
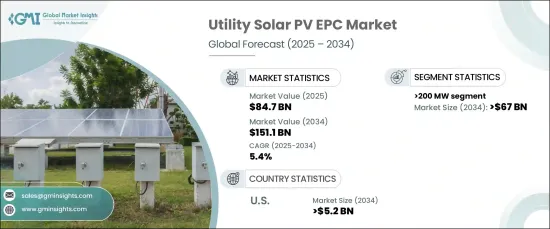
세계의 유틸리티 태양광 발전 EPC 시장은 2024년에 847억 달러로 평가되었고, 2024년부터 2034년에 걸쳐 CAGR 5.4%로 성장할 것으로 예측됩니다.
유틸리티 태양광 발전 EPC 서비스는 보통 수십에서 수백 메가와트에 이르는 전력을 송전망에 공급하는 대규모 태양광 발전(PV) 발전소에 매우 중요합니다.
지난 10년간 태양전지 모듈과 EPC 서비스 비용이 크게 줄어들었고, 규모 경제가 개선됨에 따라 계속 하락하고, 전체 비용을 낮추고 시장 경쟁을 격화시키고 있습니다. 또한, 배터리 축전 시스템(BESS)을 대규모 태양광 발전 프로젝트에 통합하는 것이 일반적으로 되고 있습니다. 이 조합은 태양광 발전의 간헐적인 성질을 완화하고 송전망의 안정성을 보장하는 데 도움이 되며, 태양광 발전을 보다 신뢰할 수 있는 에너지원으로 만듭니다. 게다가, 특히 지붕에 태양광 발전의 도입이 한정적인 지역에서의 지역 태양광 발전 프로젝트에 대한 관심 증가가 유틸리티 태양광 발전 EPC 서비스 수요에 기여하고 있습니다.
| 시장 범위 | |
|---|---|
| 시작 연도 | 2024년 |
| 예측 연도 | 2025-2034년 |
| 시작 금액 | 847억 달러 |
| 예측 금액 | 1,511억 달러 |
| CAGR | 5.4% |
이 시장은 2034년까지 670억 달러를 넘어설 것으로 예상되는 200MW 이상의 용량 부문에서 상당한 수요가 발생할 것으로 예상됩니다. 전 세계 기업들이 재생 에너지 비중을 높이기 위해 노력함에 따라 유틸리티 규모의 태양광 발전 프로젝트는 자원 가용성 증가, 용량 잠재력 확대, 저렴한 기술 등으로 인해 경쟁이 더욱 치열해지고 있습니다. 지속적인 기술 혁신과 정부의 지원, 재생 에너지에 대한 관심 증가에 힘입어 2034년까지 미국의 유틸리티 태양광 발전 EPC 서비스 시장은 52억 달러를 넘어설 것으로 예상됩니다. 30%의 세금 공제를 제공하는 ITC를 비롯한 태양광 프로젝트에 대한 세금 공제와 같은 주요 정책은 시장의 성장을 더욱 촉진하고 있습니다. 미국에서는 캘리포니아, 텍사스, 뉴욕과 같은 주에서 전력회사가 에너지의 일정 비율을 재생 가능한 자원에서 얻도록 하는 재생 에너지 의무화 정책을 시행하고 있어 수요가 더욱 증가하고 있습니다. 양면 및 이종 접합 태양전지와 같은 태양전지 패널 효율의 발전은 에너지 생산량을 높이고 태양광 프로젝트의 균등화 발전 비용(LCOE)을 낮춤으로써 태양광 산업을 발전시키고 있습니다.
아시아태평양에서는 발전차액지원제도 및 재생에너지 경매와 같은 정부 노력에 힘입어 유틸리티 태양광 발전 EPC 시장이 지속적으로 성장할 것입니다. 호주와 같은 국가에서는 전기 요금의 상승과 재생 에너지 기술 비용의 하락이 대규모 태양광 발전 프로젝트의 도입을 장려하고 있습니다. 또한, 이 지역 정부는 소프트웨어와 디지털 기술의 통합을 통해 태양광 발전 용량을 향상시키는 데 주력하고 있어 태양광 에너지 솔루션의 채택이 더욱 촉진되고 있습니다.
목차
제1장 조사 방법과 조사 범위
- 조사 디자인
- 기본 추정과 계산
- 예측 모델
- 1차 조사와 검증
- 1차 정보
- 데이터 마이닝 소스
- 시장 정의
제2장 주요 요약
제3장 업계 인사이트
- 업계 생태계
- 규제 상황
- 업계에 미치는 영향요인
- 성장 촉진요인
- 업계의 잠재적 위험 및 과제
- 성장 가능성 분석
- Porter's Five Forces 분석
- 공급기업의 협상력
- 구매자의 협상력
- 신규 참가업체의 위협
- 대체품의 위협
- PESTEL 분석
제4장 경쟁 구도
- 소개
- 전략 대시보드
- 혁신과 기술의 전망
제5장 시장 규모와 예측 : 용량별(2021-2034년)
- 주요 동향
- 10MW 이하
- 10-50MW
- 50-200MW
- 200MW 이상
제6장 시장 규모와 예측 : 지역별(2021-2034년)
- 주요 동향
- 북미
- 미국
- 캐나다
- 멕시코
- 유럽
- 프랑스
- 영국
- 네덜란드
- 이탈리아
- 독일
- 스페인
- 러시아
- 스웨덴
- 아시아태평양
- 중국
- 호주
- 인도
- 일본
- 한국
- 중동 및 아프리카
- 사우디아라비아
- 아랍에미리트(UAE)
- 남아프리카
- 이집트
- 라틴아메리카
- 브라질
- 아르헨티나
제7장 기업 프로파일
- ACME Solar
- Bharat Heavy Electricals Limited(BHEL)
- BELECTRIC
- COBRA Group
- Canadian Solar
- First Solar
- JUWI AG
- KEC International Limited
- Larsen &Toubro Limited
- Power Construction Corporation of China, Ltd.
- Risen Energy Co. Ltd.
- Ritis Meera Infra Energy LLP
- STEAG GmbH
- Swinerton Renewable Energy
- Sterling and Wilson
- SunPower Corporation
- SUNGROW
- TBEA Co., Ltd.
- Tata Power Solar Systems Ltd.
- Topsun Energy Limited
- Trina Solar
The Global Utility Solar PV EPC Market, valued at USD 84.7 billion in 2024, is expected to grow at a CAGR of 5.4% from 2024 to 2034. Utility Solar PV EPC services are critical for large-scale solar photovoltaic (PV) power plants that supply electricity to the grid, typically ranging from tens to hundreds of megawatts. The market's growth is fueled by the adoption of innovative financing methods, including tax equity financing and green bonds, which have supported the expansion of utility-scale solar projects.

Over the past decade, there has been a significant reduction in the costs of solar modules and EPC services, which continue to decline as economies of scale improve, driving down overall costs and increasing market competition. Additionally, the integration of battery energy storage systems (BESS) with utility-scale solar projects is becoming more common. This pairing helps mitigate the intermittent nature of solar power and ensures grid stability, making solar power a more reliable source of energy. Furthermore, the rising interest in community solar projects, particularly in areas with limited rooftop solar adoption, is contributing to the demand for utility solar EPC services.
| Market Scope | |
|---|---|
| Start Year | 2024 |
| Forecast Year | 2025-2034 |
| Start Value | $84.7 Billion |
| Forecast Value | $151.1 Billion |
| CAGR | 5.4% |
The market is expected to see a substantial demand in the >200 MW capacity segment, projected to surpass USD 67 billion by 2034. As companies worldwide work to increase their renewable energy share, utility-scale solar PV projects are becoming more competitive due to the growing availability of resources, increased capacity potential, and more affordable technologies. The U.S. market for utility solar PV EPC services is forecasted to exceed USD 5.2 billion by 2034, driven by continued technological innovations, government support, and a growing commitment to renewable energy. Key policies such as tax credits for solar projects, including the ITC offering a 30% tax credit, further enhance the market's growth. In the U.S., states like California, Texas, and New York have renewable energy mandates that require utilities to obtain a percentage of their energy from renewable sources, further boosting demand. Advancements in solar panel efficiency, such as bifacial and heterojunction solar cells, are driving the industry forward by increasing energy yield and lowering the Levelized Cost of Energy (LCOE) for solar projects.
The Asia Pacific region will see continued growth in the utility solar PV EPC market, supported by government initiatives like feed-in tariff schemes and renewable energy auctions. In countries like Australia, the rising cost of electricity, combined with the decreasing costs of renewable technologies, is encouraging the deployment of large-scale solar PV projects. Additionally, governments in the region are focusing on enhancing solar PV capacity through the integration of software and digital technologies, further boosting the adoption of solar energy solutions.
Table of Contents
Chapter 1 Methodology & Scope
- 1.1 Research design
- 1.2 Base estimates & calculations
- 1.3 Forecast model
- 1.4 Primary research & validation
- 1.4.1 Primary sources
- 1.4.2 Data mining sources
- 1.5 Market definitions
Chapter 2 Executive Summary
- 2.1 Industry synopsis, 2021 – 2034
Chapter 3 Industry Insights
- 3.1 Industry ecosystem
- 3.2 Regulatory landscape
- 3.3 Industry impact forces
- 3.3.1 Growth drivers
- 3.3.2 Industry pitfalls & challenges
- 3.4 Growth potential analysis
- 3.5 Porter's analysis
- 3.5.1 Bargaining power of suppliers
- 3.5.2 Bargaining power of buyers
- 3.5.3 Threat of new entrants
- 3.5.4 Threat of substitutes
- 3.6 PESTEL analysis
Chapter 4 Competitive landscape, 2024
- 4.1 Introduction
- 4.2 Strategic dashboard
- 4.3 Innovation & technology landscape
Chapter 5 Market Size and Forecast, By Capacity, 2021 – 2034 (USD Billion & MW)
- 5.1 Key trends
- 5.2 ≤ 10 MW
- 5.3 > 10 MW to 50 MW
- 5.4 > 50 MW to 200 MW
- 5.5 > 200 MW
Chapter 6 Market Size and Forecast, By Region, 2021 – 2034 (USD Billion & MW)
- 6.1 Key trends
- 6.2 North America
- 6.2.1 U.S.
- 6.2.2 Canada
- 6.2.3 Mexico
- 6.3 Europe
- 6.3.1 France
- 6.3.2 UK
- 6.3.3 Netherlands
- 6.3.4 Italy
- 6.3.5 Germany
- 6.3.6 Spain
- 6.3.7 Russia
- 6.3.8 Sweden
- 6.4 Asia Pacific
- 6.4.1 China
- 6.4.2 Australia
- 6.4.3 India
- 6.4.4 Japan
- 6.4.5 South Korea
- 6.5 Middle East & Africa
- 6.5.1 Saudi Arabia
- 6.5.2 UAE
- 6.5.3 South Africa
- 6.5.4 Egypt
- 6.6 Latin America
- 6.6.1 Brazil
- 6.6.2 Argentina
Chapter 7 Company Profiles
- 7.1 ACME Solar
- 7.2 Bharat Heavy Electricals Limited (BHEL)
- 7.3 BELECTRIC
- 7.4 COBRA Group
- 7.5 Canadian Solar
- 7.6 First Solar
- 7.7 JUWI AG
- 7.8 KEC International Limited
- 7.9 Larsen & Toubro Limited
- 7.10 Power Construction Corporation of China, Ltd.
- 7.11 Risen Energy Co. Ltd.
- 7.12 Ritis Meera Infra Energy LLP
- 7.13 STEAG GmbH
- 7.14 Swinerton Renewable Energy
- 7.15 Sterling and Wilson
- 7.16 SunPower Corporation
- 7.17 SUNGROW
- 7.18 TBEA Co., Ltd.
- 7.19 Tata Power Solar Systems Ltd.
- 7.20 Topsun Energy Limited
- 7.21 Trina Solar
