|
시장보고서
상품코드
1667189
초분광 영상시스템 시장 : 기회, 성장 촉진요인, 산업 동향 분석(2025-2034년)Hyperspectral Imaging Systems Market Opportunity, Growth Drivers, Industry Trend Analysis, and Forecast 2025 - 2034 |
||||||
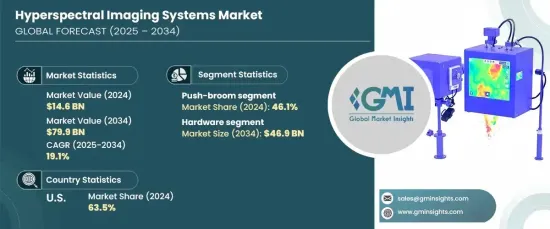
세계의 초분광 영상시스템 시장은 2024년 146억 달러로 평가되었으며, 2025년부터 2034년까지 연평균 성장률(CAGR) 19.1%로 성장할 것으로 예측됩니다.
센서 소형화, 스펙트럼 해상도 향상, 비용 효율적인 솔루션 등 초분광 영상 기술의 지속적인 발전이 시장 성장을 주도하고 있습니다. 이러한 혁신으로 드론, 무인 항공기(UAV), 휴대용 기기에 통합할 수 있는 소형 초분광 카메라와 경량 센서가 개발되어 기술의 접근성이 더욱 높아졌습니다. 초분광 영상은 원격 감지 및 현장 조사에 점점 더 많이 사용되고 있으며 지질학, 임업, 재난 관리와 같은 분야에서 그 입지를 넓혀가고 있습니다. 또한 스냅샷 초분광 카메라 및 푸시-브룸 스캐너와 같은 첨단 스캐닝 기술의 도입으로 운영이 간소화되고 소규모 산업에서 시스템을 더 쉽게 사용할 수 있게 되었습니다. 이러한 기술 혁신은 다양한 분야에서 초분광 영상의 새로운 문을 열고 있습니다.
초분광 영상 시스템 수요는 식음료와 같이 정밀한 품질 관리가 필요한 산업에서 특히 높습니다. 이러한 시스템은 오염 물질을 감지하고 식품 안전을 보장하며 제품 품질을 모니터링하는 데 필수적인 도구가 되고 있습니다. 초분광 영상은 식품의 이물질, 부패, 불일치 등을 효과적으로 식별할 수 있어 식품 안전 규정이 엄격해지고 고품질 제품에 대한 소비자 수요가 증가함에 따라 이를 지원할 수 있습니다.
| 시장 범위 | |
|---|---|
| 시작 연도 | 2024년 |
| 예측 연도 | 2025-2034년 |
| 시작 금액 | 146억 달러 |
| 예측 금액 | 799억 달러 |
| CAGR | 19.1% |
시장은 기술별로 푸시-브룸, 스냅샷, 위스크브룸 초분광 영상으로 분류할 수 있습니다. 2024년에는 푸시-브룸 초분광 영상 부문이 시장의 46.1%를 차지하며 가장 큰 규모를 차지할 것으로 예상됩니다. 푸시-브룸 기술은 공간 및 스펙트럼 해상도가 높아 특히 농업, 환경 모니터링, 국방 감시와 같은 분야에서 상세한 스펙트럼 데이터 캡처가 가능하기 때문에 널리 선호되고 있습니다. 그러나 이 기술은 뛰어난 성능을 제공하지만 스캔하는 동안 정밀한 모션 제어와 정렬이 필요하기 때문에 배포가 더 복잡하고 비용이 많이 듭니다.
초분광 영상 시스템 시장은 하드웨어와 소프트웨어 구성 요소로 나뉩니다. 하드웨어 부문은 2034년까지 469억 달러의 매출을 창출할 것으로 예상됩니다. 이 부문에는 초분광 센서, 카메라, 광원, 데이터 수집 시스템과 같은 주요 구성 요소가 포함됩니다. 센서 기술이 발전하고 소형화됨에 따라 소형 휴대형 초분광 영상 솔루션에 대한 수요가 급증하고 있습니다. 이러한 개선 덕분에 초분광 영상 시스템을 드론, UAV, 휴대용 형태로 배포할 수 있게 되어 농업, 국방, 의료 등의 분야에서 사용이 확대되고 있습니다.
2024년 미국은 국방, 항공우주, 의료 분야에 대한 막대한 투자에 힘입어 북미 시장에서 63.5%의 점유율로 압도적인 1위를 차지할 것으로 예상됩니다. 미국 국방부는 군사 감시, 표적 탐지, 국경 보안을 위해 초분광 영상을 활용하고 있습니다. 또한 의료 산업에서는 비침습적 진단, 질병 탐지, 수술 안내를 위해 이러한 시스템을 활용하고 있습니다. 미국 시장의 성장은 정밀 농업 및 식품 안전 분야에서 초분광 영상의 채택이 증가하고 연구 기관 및 정부 노력의 강력한 존재감도 뒷받침하고 있습니다.
목차
제1장 조사 방법과 조사 범위
- 시장 범위와 정의
- 기본 추정과 계산
- 예측 계산
- 데이터 소스
- 1차 데이터
- 2차 데이터
- 유료
- 공적
제2장 주요 요약
제3장 업계 인사이트
- 생태계 분석
- 밸류체인에 영향을 주는 요인
- 이익률 분석
- 혼란
- 장래 전망
- 제조업체
- 유통업체
- 공급자의 상황
- 이익률 분석
- 주요 뉴스와 대처
- 규제 상황
- 영향요인
- 성장 촉진요인
- 센서 및 소형화의 기술 발전
- 식음료 품질 관리에 대한 수요 증가
- 농업 및 환경 모니터링에서의 채택
- 방어 및 감시 용도에서 수요 증가
- 업계의 잠재적 위험 및 과제
- 높은 구현 비용과 복잡성
- 표준화된 데이터 처리 및 숙련된 인력 부족
- 성장 촉진요인
- 성장 가능성 분석
- Porter's Five Forces 분석
- PESTEL 분석
제4장 경쟁 구도
- 소개
- 기업 점유율 분석
- 경쟁 포지셔닝 매트릭스
- 전략 전망 매트릭스
제5장 시장 추계 및 예측 : 구성 요소별(2021-2034년)
- 주요 동향
- 하드웨어
- 카메라
- 센서
- 렌즈
- 검출기
- 소프트웨어
- 영상 처리 소프트웨어
- 데이터 분석 소프트웨어
- 시각화 소프트웨어
- 캘리브레이션 소프트웨어
- 스펙트럼 분석 소프트웨어
- 머신러닝 및 AI 소프트웨어
제6장 시장 추계 및 예측 : 기술별(2021-2034년)
- 주요 동향
- 푸시-브룸 초분광 영상
- 스냅샷 초분광 영상
- 위스크브룸 초분광 영상
- 기타
제7장 시장 추계 및 예측 : 스펙트럼 범위별(2021-2034년)
- 주요 동향
- 가시/근적외(VNIR)
- 단파장 적외선(SWIR)
- 장파장 적외선(LWIR)
제8장 시장 추계 및 예측 : 용도별(2021-2034년)
- 주요 동향
- 농업
- 의료 진단
- 환경 모니터링
- 식음료
- 산업 검사
- 기타
제9장 시장 추계 및 예측 : 지역별(2021-2034년)
- 주요 동향
- 북미
- 미국
- 캐나다
- 유럽
- 영국
- 독일
- 프랑스
- 이탈리아
- 스페인
- 러시아
- 아시아태평양
- 중국
- 인도
- 일본
- 한국
- 호주
- 라틴아메리카
- 브라질
- 멕시코
- 중동 및 아프리카
- 남아프리카
- 사우디아라비아
- 아랍에미리트(UAE)
제10장 기업 프로파일
- Applied Spectral Imaging
- BaySpec, Inc.
- ClydeHSI
- Corning Incorporated
- Cubert GmbH
- Diaspective Vision
- Gamaya
- Headwall Photonics, Inc.
- Hinalea Imaging Corp.
- HyperMed Imaging, Inc.
- imec
- Malvern Panalytical Ltd
- Norsk Elektro Optikk AS
- Orbital Sidekick
- Photon Etc
- Resonon
- Specim, Spectral Imaging Ltd.
- Surface Optics Corporation
- Telops Inc.
- XIMEA GmbH
The Global Hyperspectral Imaging Systems Market was valued at USD 14.6 billion in 2024 and is expected to expand at a CAGR of 19.1% from 2025 to 2034. The market growth is driven by continuous advancements in hyperspectral imaging technology, such as sensor miniaturization, enhanced spectral resolution, and cost-effective solutions. These innovations have led to the development of compact hyperspectral cameras and lightweight sensors that can be integrated into drones, unmanned aerial vehicles (UAVs), and portable devices, making the technology more accessible. Hyperspectral imaging is increasingly used for remote sensing and field surveys, expanding its presence in sectors like geology, forestry, and disaster management. Additionally, the adoption of advanced scanning technologies like snapshot hyperspectral cameras and push-broom scanners has simplified operations and made the systems easier to use for smaller industries. These technological breakthroughs are opening new doors for hyperspectral imaging in various fields.

The demand for hyperspectral imaging systems is particularly high in industries that require precise quality control, such as food and beverages. These systems are becoming vital tools for detecting contaminants, ensuring food safety, and monitoring product quality. Hyperspectral imaging can effectively identify foreign materials, spoilage, and inconsistencies in food items, supporting stricter food safety regulations and the growing consumer demand for high-quality products.
| Market Scope | |
|---|---|
| Start Year | 2024 |
| Forecast Year | 2025-2034 |
| Start Value | $14.6 billion |
| Forecast Value | $79.9 billion |
| CAGR | 19.1% |
The market can be categorized by technology into push-broom, snapshot, and whiskbroom hyperspectral imaging. The push-broom hyperspectral imaging segment was the largest in 2024, accounting for 46.1% of the market. Push-broom technology is widely favored due to its high spatial and spectral resolution, allowing for detailed spectral data capture, especially in applications like agriculture, environmental monitoring, and defense surveillance. However, while this technology provides excellent performance, its need for precise motion control and alignment during scanning makes deployment more complex and costly.
The hyperspectral imaging systems market is also divided into hardware and software components. The hardware segment is expected to generate USD 46.9 billion by 2034. This segment includes key components such as hyperspectral sensors, cameras, light sources, and data acquisition systems. With advancements in sensor technology and miniaturization, the demand for compact and portable hyperspectral imaging solutions has surged. These improvements make it possible to deploy hyperspectral imaging systems in drone, UAV, and handheld formats, expanding their use in fields like agriculture, defense, and healthcare.
In 2024, the U.S. held the dominant share of the North American market at 63.5%, driven by substantial investments in defense, aerospace, and healthcare. The U.S. Department of Defense utilizes hyperspectral imaging for military surveillance, target detection, and border security. Additionally, the healthcare industry benefits from these systems for non-invasive diagnostics, disease detection, and surgical guidance. The U.S. market's growth is also supported by the increasing adoption of hyperspectral imaging in precision agriculture and food safety, along with a strong presence of research institutions and government initiatives.
Table of Contents
Chapter 1 Methodology & Scope
- 1.1 Market scope & definitions
- 1.2 Base estimates & calculations
- 1.3 Forecast calculations
- 1.4 Data sources
- 1.4.1 Primary
- 1.4.2 Secondary
- 1.4.2.1 Paid sources
- 1.4.2.2 Public sources
Chapter 2 Executive Summary
- 2.1 Industry synopsis, 2021-2034
Chapter 3 Industry Insights
- 3.1 Industry ecosystem analysis
- 3.1.1 Factor affecting the value chain
- 3.1.2 Profit margin analysis
- 3.1.3 Disruptions
- 3.1.4 Future outlook
- 3.1.5 Manufacturers
- 3.1.6 Distributors
- 3.2 Supplier landscape
- 3.3 Profit margin analysis
- 3.4 Key news & initiatives
- 3.5 Regulatory landscape
- 3.6 Impact forces
- 3.6.1 Growth drivers
- 3.6.1.1 Technological advancements in sensors and miniaturization
- 3.6.1.2 Increased demand in food and beverage quality control
- 3.6.1.3 Adoption in agriculture and environmental monitoring
- 3.6.1.4 Rising demand in defense and surveillance applications
- 3.6.2 Industry pitfalls & challenges
- 3.6.2.1 High implementation costs and complexity
- 3.6.2.2 Lack of standardized data processing and skilled workforce
- 3.6.1 Growth drivers
- 3.7 Growth potential analysis
- 3.8 Porter’s analysis
- 3.9 PESTEL analysis
Chapter 4 Competitive Landscape, 2024
- 4.1 Introduction
- 4.2 Company market share analysis
- 4.3 Competitive positioning matrix
- 4.4 Strategic outlook matrix
Chapter 5 Market Estimates & Forecast, By Component, 2021-2034 (USD Billion)
- 5.1 Key trends
- 5.2 Hardware
- 5.2.1 Cameras
- 5.2.2 Sensors
- 5.2.3 Lenses
- 5.2.4 Detectors
- 5.3 Software
- 5.3.1 Image processing software
- 5.3.2 Data analysis software:
- 5.3.3 Visualization software
- 5.3.4 Calibration software
- 5.3.5 Spectral analysis software
- 5.3.6 Machine learning and AI software
Chapter 6 Market Estimates & Forecast, By Technology, 2021-2034 (USD Billion)
- 6.1 Key trends
- 6.2 Push-broom hyperspectral imaging
- 6.3 Snapshot hyperspectral imaging
- 6.4 Whiskbroom hyperspectral imaging
- 6.5 Others
Chapter 7 Market Estimates & Forecast, By Spectrum Range, 2021-2034 (USD Billion)
- 7.1 Key trends
- 7.2 Visible/Near-Infrared (VNIR)
- 7.3 Shortwave Infrared (SWIR)
- 7.4 Longwave Infrared (LWIR)
Chapter 8 Market Estimates & Forecast, By Application, 2021-2034 (USD Billion)
- 8.1 Key trends
- 8.2 Agriculture
- 8.3 Medical diagnostics
- 8.4 Environmental monitoring
- 8.5 Food and beverages
- 8.6 Industrial inspection
- 8.7 Others
Chapter 9 Market Estimates & Forecast, By Region, 2021-2034 (USD Billion)
- 9.1 Key trends
- 9.2 North America
- 9.2.1 U.S.
- 9.2.2 Canada
- 9.3 Europe
- 9.3.1 UK
- 9.3.2 Germany
- 9.3.3 France
- 9.3.4 Italy
- 9.3.5 Spain
- 9.3.6 Russia
- 9.4 Asia Pacific
- 9.4.1 China
- 9.4.2 India
- 9.4.3 Japan
- 9.4.4 South Korea
- 9.4.5 Australia
- 9.5 Latin America
- 9.5.1 Brazil
- 9.5.2 Mexico
- 9.6 MEA
- 9.6.1 South Africa
- 9.6.2 Saudi Arabia
- 9.6.3 UAE
Chapter 10 Company Profiles
- 10.1 Applied Spectral Imaging
- 10.2 BaySpec, Inc.
- 10.3 ClydeHSI
- 10.4 Corning Incorporated
- 10.5 Cubert GmbH
- 10.6 Diaspective Vision
- 10.7 Gamaya
- 10.8 Headwall Photonics, Inc.
- 10.9 Hinalea Imaging Corp.
- 10.10 HyperMed Imaging, Inc.
- 10.11 imec
- 10.12 Malvern Panalytical Ltd
- 10.13 Norsk Elektro Optikk AS
- 10.14 Orbital Sidekick
- 10.15 Photon Etc
- 10.16 Resonon
- 10.17 Specim, Spectral Imaging Ltd.
- 10.18 Surface Optics Corporation
- 10.19 Telops Inc.
- 10.20 XIMEA GmbH