|
시장보고서
상품코드
1892787
안과용 항VEGF 치료제 시장 기회, 성장요인, 업계 동향 분석 및 예측(2025-2034년)Ophthalmic Anti-VEGF Therapeutics Market Opportunity, Growth Drivers, Industry Trend Analysis, and Forecast 2025 - 2034 |
||||||
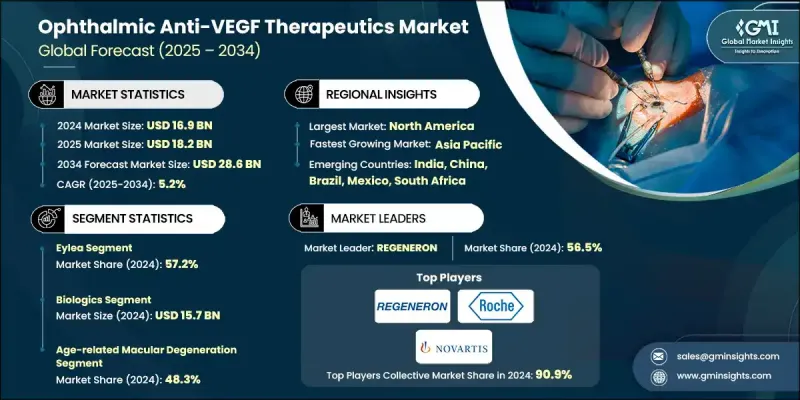
세계의 안과용 항VEGF 치료제 시장은 2024년에 169억 달러로 평가되었고, 2034년까지 연평균 복합 성장률(CAGR) 5.2%로 성장하여 286억 달러에 이를 것으로 예측됩니다.

시장 확대의 주요 요인으로는 망막 질환 증가, 전 세계 당뇨병 환자 증가, 지속적인 인구 고령화, 그리고 전문 안과 시설의 급속한 정비 등을 들 수 있습니다. 항VEGF 약물은 망막의 비정상적인 혈관 형성에 관여하는 VEGF의 활성을 억제하는 방식으로 작용합니다. 따라서 노화성 황반변성(AMD), 당뇨병성 황반부종(DME), 망막정맥폐쇄증(RVO) 등의 질환에서 이러한 치료법은 필수적입니다. 당뇨병성 망막증, 당뇨병 관련 황반부 합병증, 노화성 시력변성 환자 증가로 치료 대상 환자층이 계속 확대되고 있습니다. 동시에 지속적인 연구 노력으로 지속성 향상, 안전성 강화, 다중 경로 표적화 능력을 갖춘 개선된 분자가 만들어지고 있습니다. 이러한 혁신은 1차 치료 옵션 확대, 전환 전략 최적화, 투여 간격 연장 지원 등을 통해 치료 패턴을 재구성하고 있습니다. 치료 환경이 다양화되는 가운데, 임상적 성과와 고령화 및 당뇨병 환자층의 지속적인 수요로 인해 프리미엄 의약품 카테고리는 상업적으로 지속 가능한 상태를 유지하고 있습니다.
| 시장 범위 | |
|---|---|
| 개시 연도 | 2024년 |
| 예측 연도 | 2025-2034년 |
| 개시 연도 시장 규모 | 169억 달러 |
| 예측 금액 | 286억 달러 |
| CAGR | 5.2% |
아이레아 부문은 우수한 임상 결과, 신뢰할 수 있는 안전성, 고용량 제형에 의한 투여 간격 연장으로 2024년 57.2%의 점유율을 차지할 것으로 예측됩니다. 당뇨병성 망막증에 대한 광범위한 채택은 전 세계적으로 급증하는 당뇨병 환자 수에 의해 더욱 강화되고 있으며, 이는 장기적인 사용과 높은 연간 치료량을 지속적으로 견인하고 있습니다.
노화 관련 황반변성(AMD) 부문은 2024년 48.3%의 점유율을 차지할 것으로 예상되며, 2034년에는 1320억 달러에 달할 것으로 전망됩니다. AMD는 주로 노년층에서 발병하기 때문에 노인 인구가 빠르게 증가하는 시장에서는 치료 수요가 지속적으로 증가하고 있습니다. 항VEGF 치료는 AMD 치료의 기반이 되고 있으며, 전 세계 고령화 인구에서 꾸준한 성장세를 보이고 있습니다.
북미 안과용 항VEGF 치료제 시장은 AMD, 당뇨병성 황반부종(DME), 당뇨병성 망막증 환자층이 두터워 2024년 64.8%의 점유율을 차지할 것으로 예측됩니다. 이 지역은 탄탄한 임상 인프라, 풍부한 전문의 확보, 그리고 지속적인 치료 순응도를 높이는 고효율적인 공급 및 투약 시스템의 이점을 가지고 있습니다.
자주 묻는 질문
목차
제1장 조사 방법과 범위
제2장 주요 요약
제3장 업계 인사이트
- 생태계 분석
- 공급업체 상황
- 밸류체인에 영향을 미치는 요인
- 업계에 대한 영향요인
- 성장 촉진요인
- 업계의 잠재적 리스크&과제
- 시장 기회
- 성장 가능성 분석
- 규제 상황
- 북미
- 유럽
- 아시아태평양
- 기술 동향
- 현재 기술 동향
- 신기술
- 향후 시장 동향
- 파이프라인 분석
- 가격 분석, 2024
- Porter's Five Forces 분석
- PESTEL 분석
제4장 경쟁 구도
- 서론
- 기업 매트릭스 분석
- 기업의 시장 점유율 분석
- 세계
- 북미
- 유럽
- 아시아태평양
- 경쟁 포지셔닝 매트릭스
- 주요 시장 기업의 경쟁 분석
- 주요 발전
- 인수합병(M&A)
- 제휴 및 협업
- 신제품 발매
- 확대 계획
제5장 시장 추산 및 예측 : 항VEGF 요법별, 2021-2034
- 주요 동향
- Eylea
- Vabysmo
- Lucentis
- 기타 항VEGF 요법
제6장 시장 추산 및 예측 : 약제 유형별, 2021-2034
- 주요 동향
- 생물학적 제제
- 바이오시밀러
제7장 시장 추산 및 예측 : 적응증별, 2021-2034
- 주요 동향
- 노인 황반 변성
- 당뇨병 망막증
- 황반부종
- 망막 정맥 폐쇄 증
- 근시성 맥락막 신생 혈관
제8장 시장 추산 및 예측 : 지역별, 2021-2034
- 주요 동향
- 북미
- 미국
- 캐나다
- 유럽
- 독일
- 영국
- 프랑스
- 스페인
- 이탈리아
- 네덜란드
- 아시아태평양
- 중국
- 일본
- 인도
- 호주
- 한국
- 라틴아메리카
- 브라질
- 멕시코
- 아르헨티나
- 중동 및 아프리카
- 남아프리카공화국
- 사우디아라비아
- 아랍에미리트(UAE)
제9장 기업 개요
- AMGEN
- Astellas
- Biocon Biologics
- Biogen
- CELLTRION
- Intas Pharmaceuticals
- KANGHONG PHARMACEUTICALS
- LUPIN
- NOVARTIS
- REGENERON
- Reliance Life Sciences
- Roche
- SANDOZ
- STADA
- teva
The Global Ophthalmic Anti-VEGF Therapeutics Market was valued at USD 16.9 billion in 2024 and is estimated to grow at a CAGR of 5.2% to reach USD 28.6 billion by 2034.
Market expansion is driven by the rise in retinal disorders, the global increase in diabetes, continued population aging, and the rapid establishment of specialized ophthalmic facilities. Anti-VEGF drugs work by blocking VEGF activity, which contributes to abnormal blood vessel formation in the retina, making these therapies essential for conditions such as age-related macular degeneration (AMD), diabetic macular edema (DME), and retinal vein occlusion (RVO). Increasing cases of diabetic retinopathy, diabetes-related macular complications, and age-related visual degeneration continue to widen the treatment pool. At the same time, continual research efforts are delivering improved molecules with longer durability, enhanced safety, and multi-pathway targeting capabilities. These innovations are reshaping treatment patterns by expanding options for first-line therapies, optimizing switching strategies, and supporting longer dosing intervals. As the therapeutic landscape diversifies, premium drug categories remain commercially viable due to clinical performance and sustained demand across aging and diabetic populations.
| Market Scope | |
|---|---|
| Start Year | 2024 |
| Forecast Year | 2025-2034 |
| Start Value | $16.9 Billion |
| Forecast Value | $28.6 Billion |
| CAGR | 5.2% |
The Eylea segment held a 57.2% share in 2024, supported by strong clinical outcomes, reliable safety, and longer dosing cycles enabled by its higher-dose formulation. Its broad adoption in diabetic retinal diseases is reinforced by the fast-growing global diabetic population, which consistently drives long-term utilization and high annual treatment volumes.
The age-related macular degeneration segment accounted for a 48.3% share in 2024 and is expected to reach USD 13.2 billion through 2034. As AMD primarily affects older adults, markets with rapidly expanding senior populations continue to see rising therapy demand. Anti-VEGF treatment remains the cornerstone of AMD care, resulting in steady growth across aging demographics worldwide.
North America Ophthalmic Anti-VEGF Therapeutics Market held a 64.8% share in 2024, supported by a large patient base with AMD, DME, and diabetic retinopathy. The region benefits from robust clinical infrastructure, extensive specialist availability, and highly efficient supply and administration systems that facilitate ongoing treatment adherence.
Major companies participating in the Global Ophthalmic Anti-VEGF Therapeutics Market include AMGEN, Astellas, Biocon Biologics, Biogen, CELLTRION, Intas Pharmaceuticals, KANGHONG PHARMACEUTICALS, LUPIN, NOVARTIS, REGENERON, Reliance Life Sciences, Roche, SANDOZ, STADA, and Teva. Companies operating in the Ophthalmic Anti-VEGF Therapeutics Market are adopting several strategic approaches to strengthen their position. Many are investing heavily in next-generation molecules with extended durability to reduce injection burden and improve patient outcomes. Firms are expanding clinical trials across multiple retinal conditions to broaden therapeutic indications and secure a larger market share. Partnerships, co-development agreements, and biosimilar expansion strategies are helping companies reach new geographies and diversify product portfolios. Manufacturers are also prioritizing real-world evidence programs to reinforce clinical value and support reimbursement negotiations.
Table of Contents
Chapter 1 Methodology and Scope
- 1.1 Market scope and definitions
- 1.2 Research design
- 1.2.1 Research approach
- 1.2.2 Data collection methods
- 1.3 Data mining sources
- 1.3.1 Global
- 1.3.2 Regional/country
- 1.4 Base estimates and calculations
- 1.4.1 Base year calculation
- 1.4.2 Key trends for market estimation
- 1.5 Primary research and validation
- 1.5.1 Primary sources
- 1.6 Forecast model
- 1.7 Research assumptions and limitations
Chapter 2 Executive Summary
- 2.1 Industry 3600 synopsis
- 2.2 Key market trends
- 2.2.1 Regional trends
- 2.2.2 Anti-VEGF therapies trends
- 2.2.3 Drug type trends
- 2.2.4 Indication trends
- 2.3 CXO perspectives: Strategic imperatives
- 2.3.1 Key decision points for industry executives
- 2.3.2 Critical success factors for market players
- 2.4 Future outlook and strategic recommendations
Chapter 3 Industry Insights
- 3.1 Industry ecosystem analysis
- 3.1.1 Supplier landscape
- 3.1.2 Factors affecting the value chain
- 3.2 Industry impact forces
- 3.2.1 Growth drivers
- 3.2.1.1 Increasing prevalence of eye diseases
- 3.2.1.2 Rise in aging population
- 3.2.1.3 Technological advancements in drug development
- 3.2.1.4 Growing awareness towards timely treatment of ophthalmic disorders
- 3.2.2 Industry pitfalls and challenges
- 3.2.2.1 High cost of treatment
- 3.2.2.2 Side effects and safety concerns
- 3.2.3 Market opportunities
- 3.2.3.1 Biosimilars and lower-cost alternatives expanding access
- 3.2.3.2 Expansion into emerging markets with growing healthcare access
- 3.2.1 Growth drivers
- 3.3 Growth potential analysis
- 3.4 Regulatory landscape
- 3.4.1 North America
- 3.4.2 Europe
- 3.4.3 Asia Pacific
- 3.5 Technology landscape
- 3.5.1 Current technological trends
- 3.5.2 Emerging technologies
- 3.6 Future market trends
- 3.7 Pipeline analysis
- 3.8 Pricing analysis, 2024
- 3.9 Porter's analysis
- 3.10 PESTEL analysis
Chapter 4 Competitive Landscape, 2024
- 4.1 Introduction
- 4.2 Company matrix analysis
- 4.3 Company market share analysis
- 4.3.1 Global
- 4.3.2 North America
- 4.3.3 Europe
- 4.3.4 Asia Pacific
- 4.4 Competitive positioning matrix
- 4.5 Competitive analysis of major market players
- 4.6 Key developments
- 4.6.1 Mergers & acquisitions
- 4.6.2 Partnerships & collaborations
- 4.6.3 New product launches
- 4.6.4 Expansion plans
Chapter 5 Market Estimates and Forecast, By Anti-VEGF Therapies, 2021 - 2034 ($ Mn)
- 5.1 Key trends
- 5.2 Eylea
- 5.3 Vabysmo
- 5.4 Lucentis
- 5.5 Other anti-VEGF therapies
Chapter 6 Market Estimates and Forecast, By Drug Type, 2021 - 2034 ($ Mn)
- 6.1 Key trends
- 6.2 Biologics
- 6.3 Biosimilars
Chapter 7 Market Estimates and Forecast, By Indication, 2021 - 2034 ($ Mn)
- 7.1 Key trends
- 7.2 Age-related macular degeneration
- 7.3 Diabetic retinopathy
- 7.4 Macular edema
- 7.5 Retinal vein occlusion
- 7.6 Myopic choroidal neovascularization
Chapter 8 Market Estimates and Forecast, By Region, 2021 - 2034 ($ Mn)
- 8.1 Key trends
- 8.2 North America
- 8.2.1 U.S.
- 8.2.2 Canada
- 8.3 Europe
- 8.3.1 Germany
- 8.3.2 UK
- 8.3.3 France
- 8.3.4 Spain
- 8.3.5 Italy
- 8.3.6 Netherlands
- 8.4 Asia Pacific
- 8.4.1 China
- 8.4.2 Japan
- 8.4.3 India
- 8.4.4 Australia
- 8.4.5 South Korea
- 8.5 Latin America
- 8.5.1 Brazil
- 8.5.2 Mexico
- 8.5.3 Argentina
- 8.6 Middle East and Africa
- 8.6.1 South Africa
- 8.6.2 Saudi Arabia
- 8.6.3 UAE
Chapter 9 Company Profiles
- 9.1 AMGEN
- 9.2 Astellas
- 9.3 Biocon Biologics
- 9.4 Biogen
- 9.5 CELLTRION
- 9.6 Intas Pharmaceuticals
- 9.7 KANGHONG PHARMACEUTICALS
- 9.8 LUPIN
- 9.9 NOVARTIS
- 9.10 REGENERON
- 9.11 Reliance Life Sciences
- 9.12 Roche
- 9.13 SANDOZ
- 9.14 STADA
- 9.15 teva