
|
시장보고서
상품코드
1698542
식물성 우유 시장 기회, 성장 촉진 요인, 산업 동향 분석, 예측(2025-2034년)Plant Milk Market Opportunity, Growth Drivers, Industry Trend Analysis, and Forecast 2025-2034 |
||||||
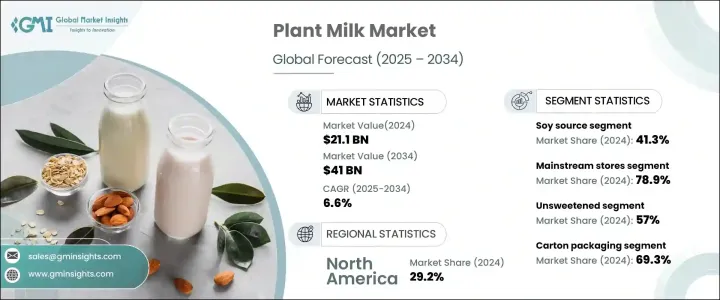
세계의 식물성 우유 시장은 2024년에 211억 달러로 평가되었으며, 2025년부터 2034년에 걸쳐 CAGR 6.6%로 성장할 것으로 예측되고 있습니다.
이 성장의 원동력이 되고 있는 것은 식물 유래의 식품에 대한 수요 증가, 영양 강화, 제조업체간의 전략적 제휴입니다. 소비자들은 유제품 대체 식품으로 전환하고 있으며, 생산자들은 칼슘, 비타민 D, 비타민 B12와 같은 필수 영양소로 식물성 우유를 강화하고 있습니다.
건강 지향의 소비자와 지속가능성에 대한 관심도 시장의 확대에 기여하고 있습니다. 게다가 수십 년에 걸친 조사는 식물 기반 식단이 만성 질환을 예방하는 데 도움이 될 수 있음을 시사하며 이러한 대체 식품에 대한 소비자의 신뢰를 강화하고 있습니다.
| 시장 범위 | |
|---|---|
| 시작 연도 | 2024년 |
| 예측 연도 | 2025-2034년 |
| 시작 금액 | 211억 달러 |
| 예측 금액 | 410억 달러 |
| CAGR | 6.6% |
시장은 원료별로 두유, 아몬드, 귀리, 쌀, 코코넛 및 기타 식물성 옵션으로 구분됩니다. 매출의 41.3%를 차지했습니다.아몬드 밀크는 여전히 건강 지향 소비자에게 인기 있는 선택이며, 오토 밀크는 그 크림 같은 텍스처로 인기를 얻고 있습니다. 라이스 밀크는 저 알레르기성으로 선호되어 그대로 마실 수 있는 시리얼이나 음료의 스테디셀러가 되고 있습니다. 완두콩 우유, 햄프 우유와 같은 새로운 대체 우유는 높은 단백질 함량과 알레르겐 프리의 장점으로 주목을 받고 있으며 시장 혁신을 촉진하고 있습니다.
식물 우유는 주류 소매점, 전문점, 전자상거래 플랫폼 등 다양한 유통 채널에서 널리 판매되고 있습니다. 11.4%로 성장할 것으로 예상됩니다. 셀프서비스 소매점은 식물성 우유를 보다 저렴한 가격으로 하고 있으며, 전문점은 유기농과 강화 옵션으로 틈새 시장에 대응하고 있습니다.
시장은 제형에 따라 구분되며, 2024년에는 무당 식물성 우유가 57%의 점유율을 차지했습니다. 무설탕 옵션은 피트니스 중심의 소비자들에게 매력적이지만, 추가 가공 비용으로 인한 가격 상승에도 불구하고 음료와 디저트에서는 여전히 인기가 높습니다.
포장의 선호도가 시장을 더욱 형성하고 있으며, 2024년에는 카톤 포장이 총 매출의 69.3%를 차지합니다. 11.7%로 성장할 것으로 예상됩니다.
북미는 2024년 매출액 점유율 29.2%로 식물 우유 시장을 선도하고 있지만, 아시아태평양이 가장 높은 성장을 이룰 것으로 예상됩니다. 지속 가능한 식품 생산을 지원하는 정부의 이니셔티브와 식물성 식생활의 채용 증가가 시장의 성장을 더욱 강화하고 있습니다.
목차
제1장 조사 방법과 조사 범위
- 시장 범위와 정의
- 기본 추정과 계산
- 예측 계산
- 데이터 소스
- 1차 조사와 검증
제2장 주요 요약
제3장 업계 인사이트
- 생태계 분석
- 밸류체인에 영향을 주는 요인
- 이익률 분석
- 혁신
- 장래의 전망
- 제조업체
- 유통업체
- 공급자의 상황
- 이익률 분석
- 주요 뉴스
- 규제 상황
- 영향요인
- 성장 촉진요인
- 영양 강화 강화
- 식물성 식품에 대한 소비자 수요 증가
- 업계 관계자간의 협력
- 채널
- 업계의 잠재적 위험 및 과제
- 격렬한 경쟁
- 기존의 유제품과 비교했을 때의 가격 상승
- 성장 촉진요인
- 성장 가능성 분석
- Porter's Five Forces 분석
- PESTEL 분석
제4장 경쟁 구도
- 소개
- 기업 점유율 분석
- 경쟁 포지셔닝 매트릭스
- 전략 전망 매트릭스
제5장 시장 추정 및 예측 : 원료별, 2021년-2034년
- 주요 동향
- 콩
- 아몬드
- 귀리
- 쌀
- 코코넛
- 기타
제6장 시장 추정 및 예측 : 유통 채널별, 2021년-2034년
- 주요 동향
- 주요 점포
- 전문점
- 기타(온라인, 자연 식품점)
제7장 시장 추정 및 예측 : 제제별, 2021년-2034년
- 주요 동향
- 무당
- 가당
제8장 시장 추정 및 예측 : 포장재별, 2021년-2034년
- 주요 동향
- 판지 포장
- 병
- 파우치
제9장 시장 추정 및 예측 : 지역별, 2021년-2034년
- 주요 동향
- 북미
- 미국
- 캐나다
- 유럽
- 독일
- 영국
- 프랑스
- 스페인
- 이탈리아
- 러시아
- 아시아태평양
- 중국
- 인도
- 일본
- 호주
- 한국
- 라틴아메리카
- 브라질
- 멕시코
- 중동 및 아프리카
- 사우디아라비아
- 남아프리카
- 아랍에미리트(UAE)
제10장 기업 프로파일
- Blue Diamond Growers
- Califia Farms
- Danone
- Elmhurst 1925
- Mooala
- Nestle
- Oatly AB
- Pacific Foods
- Plenish
- Ripple Foods
- SunOpta Inc.
- The Hain Celestial Group
- WhiteWave Foods
The Global Plant Milk Market was valued at USD 21.1 billion in 2024 and is projected to expand at a CAGR of 6.6% from 2025 to 2034. This growth is fueled by increasing demand for plant-based foods, nutritional enhancements, and strategic partnerships among manufacturers. Consumers are shifting toward dairy alternatives, prompting producers to fortify plant milk with essential nutrients such as calcium, vitamin D, and vitamin B12. This fortification positions plant milk as a comparable substitute for traditional dairy products, further driving adoption.

Health-conscious consumers and sustainability concerns are also contributing to market expansion. Awareness of the environmental impact of dairy farming and the growing preference for plant-based diets are accelerating the shift toward plant milk. Additionally, decades of research suggest that plant-based diets help prevent chronic diseases, reinforcing consumer confidence in these alternatives.
| Market Scope | |
|---|---|
| Start Year | 2024 |
| Forecast Year | 2025-2034 |
| Start Value | $21.1 Billion |
| Forecast Value | $41 Billion |
| CAGR | 6.6% |
The market is segmented by source into soy, almond, oat, rice, coconut, and other plant-based options. Soy milk accounted for 41.3% of total revenue in 2024, primarily due to its high protein content and affordability. Almond milk remains a popular choice for health-focused consumers, while oat milk has gained traction due to its creamy texture. Rice milk is preferred for its hypoallergenic properties, making it a staple in ready-to-drink cereals and beverages. Coconut milk continues to be widely used in cooking and tropical beverages. Emerging alternatives, such as cashew, pea, and hemp milk, are gaining attention for their high protein content and allergen-free benefits, fostering innovation in the market.
Plant milk is widely available across various distribution channels, including mainstream retailers, specialty stores, and e-commerce platforms. In 2024, mainstream stores dominated the market with a 78.9% share and are projected to grow at a CAGR of 11.4% as consumer accessibility increases. Self-service retailers are making plant milk more affordable, while specialty stores cater to niche markets with organic and fortified options. Online platforms play a vital role in market expansion, allowing direct-to-consumer brands to reach a broader audience.
The market is also segmented by formulation, with unsweetened plant milk capturing 57% of the share in 2024. Rising health consciousness and increasing cases of diabetes have driven demand for low-sugar alternatives. While unsweetened options appeal to fitness-oriented consumers, sweetened plant milk remains popular in beverages and desserts, despite higher prices due to additional processing costs.
Packaging preferences further shape the market, with carton packaging accounting for 69.3% of total sales in 2024. This segment is expected to grow at a CAGR of 11.7%, driven by sustainability concerns and consumer preference for portable servings. Cartons lead due to their eco-friendly appeal, bottles cater to premium segments, and pouches offer convenience at a lower cost.
North America led the plant milk market with a 29.2% revenue share in 2024, but the Asia-Pacific region is poised for the highest growth. Urbanization, rising disposable income, and changing dietary habits in countries like China and India are fueling demand. Government initiatives supporting sustainable food production and the increasing adoption of plant-based diets further strengthen market growth. With plant-based milk already comprising 15% of total retail milk sales, the market is set to witness continued expansion.
Table of Contents
Chapter 1 Methodology & Scope
- 1.1 Market scope & definition
- 1.2 Base estimates & calculations
- 1.3 Forecast calculation
- 1.4 Data sources
- 1.4.1 Primary
- 1.4.2 Secondary
- 1.4.2.1 Paid sources
- 1.4.2.2 Public sources
- 1.5 Primary research and validation
- 1.5.1 Primary sources
- 1.5.2 Data mining sources
Chapter 2 Executive Summary
- 2.1 Industry synopsis, 2021-2034
Chapter 3 Industry Insights
- 3.1 Industry ecosystem analysis
- 3.1.1 Factor affecting the value chain
- 3.1.2 Profit margin analysis
- 3.1.3 Disruptions
- 3.1.4 Future outlook
- 3.1.5 Manufacturers
- 3.1.6 Distributors
- 3.2 Supplier landscape
- 3.3 Profit margin analysis
- 3.4 Key news & initiatives
- 3.5 Regulatory landscape
- 3.6 Impact forces
- 3.6.1 Growth drivers
- 3.6.1.1 Enhanced nutritional fortification
- 3.6.1.2 Increasing consumer demand for plant-based diets
- 3.6.1.3 Collaboration between industry players
- 3.6.1.4 channels
- 3.6.2 Industry pitfalls & challenges
- 3.6.2.1 Intense competition.
- 3.6.2.2 Higher prices compared to conventional dairy milk
- 3.6.1 Growth drivers
- 3.7 Growth potential analysis
- 3.8 Porter's analysis
- 3.9 PESTEL analysis
Chapter 4 Competitive Landscape, 2024
- 4.1 Introduction
- 4.2 Company market share analysis
- 4.3 Competitive positioning matrix
- 4.4 Strategic outlook matrix
Chapter 5 Market Estimates and Forecast, By Source, 2021 – 2034 (USD Billion) (Kilo Tons)
- 5.1 Key trends
- 5.2 Soy
- 5.3 Almond
- 5.4 Oat
- 5.5 Rice
- 5.6 Coconut
- 5.7 Others
Chapter 6 Market Estimates and Forecast, By Distribution Channel, 2021 – 2034 (USD Billion) (Kilo Tons)
- 6.1 Key trends
- 6.2 Mainstream stores
- 6.3 Specialty stores
- 6.4 Others (online, natural food stores)
Chapter 7 Market Estimates and Forecast, By Formulation, 2021 – 2034 (USD Billion) (Kilo Tons)
- 7.1 Key trends
- 7.2 Unsweetened
- 7.3 Sweetened
Chapter 8 Market Estimates and Forecast, By Packaging, 2021 – 2034 (USD Billion) (Kilo Tons)
- 8.1 Key trends
- 8.2 Carton packaging
- 8.3 Bottles
- 8.4 Pouches
Chapter 9 Market Estimates and Forecast, By Region, 2021 – 2034 (USD Billion) (Kilo Tons)
- 9.1 Key trends
- 9.2 North America
- 9.2.1 U.S.
- 9.2.2 Canada
- 9.3 Europe
- 9.3.1 Germany
- 9.3.2 UK
- 9.3.3 France
- 9.3.4 Spain
- 9.3.5 Italy
- 9.3.6 Russia
- 9.4 Asia Pacific
- 9.4.1 China
- 9.4.2 India
- 9.4.3 Japan
- 9.4.4 Australia
- 9.4.5 South Korea
- 9.5 Latin America
- 9.5.1 Brazil
- 9.5.2 Mexico
- 9.6 Middle East and Africa
- 9.6.1 Saudi Arabia
- 9.6.2 South Africa
- 9.6.3 UAE
Chapter 10 Company Profiles
- 10.1 Blue Diamond Growers
- 10.2 Califia Farms
- 10.3 Danone
- 10.4 Elmhurst 1925
- 10.5 Mooala
- 10.6 Nestle
- 10.7 Oatly AB
- 10.8 Pacific Foods
- 10.9 Plenish
- 10.10 Ripple Foods
- 10.11 SunOpta Inc.
- 10.12 The Hain Celestial Group
- 10.13 WhiteWave Foods
