
|
시장보고서
상품코드
1698549
애그리볼리택스(영농형 태양광 발전) 시장 기회, 성장 촉진 요인, 산업 동향 분석, 예측(2025-2034년)Agrivoltaic Market Opportunity, Growth Drivers, Industry Trend Analysis, and Forecast 2025-2034 |
||||||
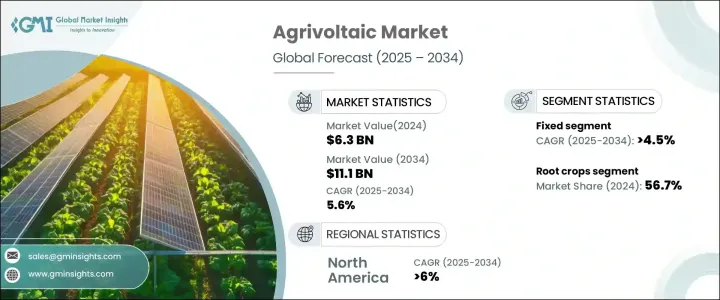
세계 애그리볼리택스(영농형 태양광 발전) 시장은 2024년에 63억 달러로 평가되었으며, 2025년부터 2034년까지 5.6%의 연평균 복합 성장률(CAGR)로 성장할 것으로 예측됩니다.
농업 활동과 일체화한 대규모 태양광 발전 설비의 채용이 증가하고 있는 것이 이 확대를 뒷받침하고 있습니다. 정부와 민간 기업은 비용 효율적인 공동 설치 모델을 장려하는 자금 조달 이니셔티브를 도입하고 있어 업계 정세를 재구축하고 있습니다. 확보를 위한 규제 프레임워크가 세계에 확립되고 있습니다. 특히, 토지가 부족한 지역에서 농지 최적화의 요구가 높아지고 있는 것이 보급에 박차를 가하고 있는 한편, 다양한 지역에서 광대한 농지와 풍부한 일조량이 업계의 확대를 더욱 뒷받침하고 있습니다.
애그리볼리택스(영농형 태양광 발전)시스템은 식량과 전력의 효율적인 생산을 촉진하고 경제 성장에 공헌합니다. 공식과 동적 구조가 있으며, 각각이 농업 활동을 방해하지 않고 토지 최적화에 기여하고 있습니다. 4.5%로 성장할 것으로 예상됩니다. 신뢰성이 높고 비용 효율적인 태양에너지 솔루션에 대한 수요가 보급을 가속화하는 한편, 설치 프로세스의 간소화에 대한 요구가 시장 침투를 더욱 촉진하고 있습니다.
| 시장 범위 | |
|---|---|
| 시작 연도 | 2024년 |
| 예측 연도 | 2025-2034년 |
| 시작금액 | 63억 달러 |
| 예측 금액 | 111억 달러 |
| CAGR | 5.6% |
수확물 유형별로 보면 시장에는 근채류, 야채, 과일이 포함되어 있습니다. 6% 이상으로 성장할 것으로 예측됩니다. 안정된 토양 수분을 유지하면서 수분의 증발을 최소화하는 태양전지판의 능력은 중요한 이점이며, 현재 진행중인 조사에 의해 아그리바이오 농법에 적합한 작물 품종이 더욱 확인되고 있습니다. 야채는 시장의 20% 가까이를 차지하고 있습니다. 아그리보라틱의 과일 분야는 증발율의 감소, 미기후의 개선, 농가의 수입 증가의 가능성에 의해 견인력을 늘리고 있습니다.
미국에서는 아그리볼타 시장이 2022년에 6억 8,000만 달러, 2023년에 7억 2,000만 달러, 2024년에 7억 7,000만 달러에 이르렀습니다. CAGR 6% 로 성장할 것으로 예상됩니다. 작물의 건강 상태를 감시하고 에너지 생산을 최적화하기 위해 설계된 스마트 애그리볼리택스(영농형 태양광 발전) 시스템이 이 성장에 기여하고 있으며, 이 지역은 선진적인 태양과 농업의 통합의 주요 시장으로 자리잡고 있습니다.
목차
제1장 조사 방법과 조사 범위
- 시장의 정의
- 기본 추정과 계산
- 예측 계산
- 데이터 소스
제2장 주요 요약
제3장 업계 인사이트
- 생태계 분석
- 벤더 매트릭스
- 규제 상황
- 업계에 미치는 영향요인
- 성장 촉진요인
- 업계의 잠재적 위험 및 과제
- 업계 전망에 대한 COVID-19의 영향
- 성장 가능성 분석
- Porter's Five Forces 분석
- PESTEL 분석
제4장 경쟁 구도
- 전략 대시보드
- 혁신과 지속가능성의 전망
제5장 시장 규모와 예측 : 시스템 디자인별, 2021년-2034년
- 주요 동향
- 고정
- 동적
제6장 시장 규모와 예측 : 수확 유형별, 2021년-2034년
- 주요 동향
- 근채류
- 야채
- 과일
제7장 시장 규모와 예측 : 게재위치별, 2021년-2034년
- 주요 동향
- 단체
- 차광 넷
- 온실
- 기타
제8장 시장 규모와 예측 : 지역별, 2021년-2034년
- 주요 동향
- 북미
- 미국
- 캐나다
- 멕시코
- 유럽
- 오스트리아
- 노르웨이
- 덴마크
- 핀란드
- 프랑스
- 아시아태평양
- 중국
- 호주
- 인도
- 한국
- 세계 기타 지역
제9장 기업 프로파일
- TotalEnergies
- Agrivoltaic Solution LLC
- Cero Generation Limited
- Sun'Agr
- iSun, Inc.
- REM TEC
- Trina Solar
- Jinko Solar
- VALOREM
- SunPower Corporation
- Next2Sun
- Enel Spa
- Solaria
- Waaree Energies Ltd.
- Insolight
- Vattenfall AB
- Chint New Energy Technology Co., Ltd.
The Global Agrivoltaic Market, valued at USD 6.3 billion in 2024, is projected to grow at a 5.6% CAGR from 2025 to 2034. The increasing adoption of large-scale solar installations integrated with agricultural activities is driving this expansion. By providing partial shade, solar panels protect crops and livestock from extreme heat and drought, enhancing productivity in agrarian economies. Governments and private enterprises continue to introduce funding initiatives that encourage cost-effective co-location models, reshaping the industry landscape. Additionally, regulatory frameworks are being established worldwide to standardize installations and ensure sustainable deployment. Developed economies, including France, Germany, and Italy, are actively incorporating agrivoltaic systems to optimize land use and improve energy efficiency. The rising need for agricultural land optimization, particularly in land-scarce regions, is fueling adoption, while extensive agricultural landscapes and abundant sunlight in various regions further boost the industry's expansion.
Agrivoltaic systems facilitate the efficient production of food and electricity, contributing to economic growth. The panels installed over vegetation operate at lower temperatures, improving efficiency and enhancing overall energy output. Market segmentation by system design includes fixed and dynamic structures, each contributing to land optimization without disrupting farming activities. Fixed agrivoltaic systems, valued at USD 5.5 billion in 2022, USD 5.9 billion in 2023, and USD 6.3 billion in 2024, are expected to grow at a 4.5% CAGR through 2034. The demand for reliable and cost-effective solar energy solutions is accelerating adoption, while the need for simplified installation processes is further driving market penetration. The push for higher energy yields and improved crop productivity is increasing the deployment of dynamic systems, with innovations in tracking mechanisms enhancing overall performance.
| Market Scope | |
|---|---|
| Start Year | 2024 |
| Forecast Year | 2025-2034 |
| Start Value | $6.3 Billion |
| Forecast Value | $11.1 Billion |
| CAGR | 5.6% |
By harvest type, the market includes root crops, vegetables, and fruits. Root crops represented 56.7% of the market in 2024 and are projected to grow at over 6% CAGR through 2032. The ability of solar panels to minimize water evaporation while maintaining stable soil moisture is a key advantage, with ongoing research identifying additional crop varieties suited for agrivoltaic farming. Vegetables accounted for nearly 20% of the market, as farmers seek additional revenue streams and focus on sustainable farming methods. The agrivoltaic fruit sector is gaining traction due to reduced evaporation rates, improved microclimates, and enhanced income potential for farmers. Pilot projects exploring diverse applications continue to increase interest in the technology.
In the U.S., the agrivoltaic market reached USD 680 million in 2022, USD 720 million in 2023, and USD 770 million in 2024. North America's market is forecasted to expand at a CAGR exceeding 6% through 2034, driven by growing solar energy demand and limited land availability. Smart agrivoltaic systems, designed for monitoring crop health and optimizing energy production, are contributing to this growth, positioning the region as a key market for advanced solar-agriculture integration.
Table of Contents
Chapter 1 Methodology & Scope
- 1.1 Market definitions
- 1.2 Base estimates & calculations
- 1.3 Forecast calculation
- 1.4 Data sources
- 1.4.1 Primary
- 1.4.2 Secondary
- 1.4.2.1 Paid sources
- 1.4.2.2 Unpaid sources
Chapter 2 Executive Summary
- 2.1 Industry 360° synopsis, 2021 – 2034
Chapter 3 Industry Insights
- 3.1 Industry ecosystem analysis
- 3.1.1 Vendor Matrix
- 3.2 Regulatory landscape
- 3.3 Industry impact forces
- 3.3.1 Growth drivers
- 3.3.2 Industry pitfalls & challenges
- 3.4 COVID- 19 impact on the industry outlook
- 3.5 Growth potential analysis
- 3.6 Porter's Analysis
- 3.6.1 Bargaining power of suppliers
- 3.6.2 Bargaining power of buyers
- 3.6.3 Threat of new entrants
- 3.6.4 Threat of substitutes
- 3.7 PESTEL Analysis
Chapter 4 Competitive landscape, 2024
- 4.1 Strategic dashboard
- 4.2 Innovation & sustainability landscape
Chapter 5 Market Size and Forecast, By System Design, 2021 – 2034 (USD Million)
- 5.1 Key trends
- 5.2 Fixed
- 5.3 Dynamic
Chapter 6 Market Size and Forecast, By Harvest Type, 2021 – 2034 (USD Million)
- 6.1 Key trends
- 6.2 Root crops
- 6.3 Vegetables
- 6.4 Fruits
Chapter 7 Market Size and Forecast, By Placement, 2021 – 2034 (USD Million)
- 7.1 Key trends
- 7.2 Standalone
- 7.3 Shading nets
- 7.4 Greenhouses
- 7.5 Others
Chapter 8 Market Size and Forecast, By Region, 2021 – 2034 (USD million)
- 8.1 Key trends
- 8.2 North America
- 8.2.1 U.S.
- 8.2.2 Canada
- 8.2.3 Mexico
- 8.3 Europe
- 8.3.1 Austria
- 8.3.2 Norway
- 8.3.3 Denmark
- 8.3.4 Finland
- 8.3.5 France
- 8.4 Asia Pacific
- 8.4.1 China
- 8.4.2 Australia
- 8.4.3 India
- 8.4.4 South Korea
- 8.5 Rest of World
Chapter 9 Company Profiles
- 9.1 TotalEnergies
- 9.2 Agrivoltaic Solution LLC
- 9.3 Cero Generation Limited
- 9.4 Sun’Agr
- 9.5 iSun, Inc.
- 9.6 REM TEC
- 9.7 Trina Solar
- 9.8 Jinko Solar
- 9.9 VALOREM
- 9.10 SunPower Corporation
- 9.11 Next2Sun
- 9.12 Enel Spa
- 9.13 Solaria
- 9.14 Waaree Energies Ltd.
- 9.15 Insolight
- 9.16 Vattenfall AB
- 9.17 Chint New Energy Technology Co., Ltd.

