|
시장보고서
상품코드
1859025
부유식 태양광발전 시장 기회, 성장 촉진요인, 산업 동향 분석 및 예측(2025-2034년)Floating Solar PV Market Opportunity, Growth Drivers, Industry Trend Analysis, and Forecast 2025 - 2034 |
||||||
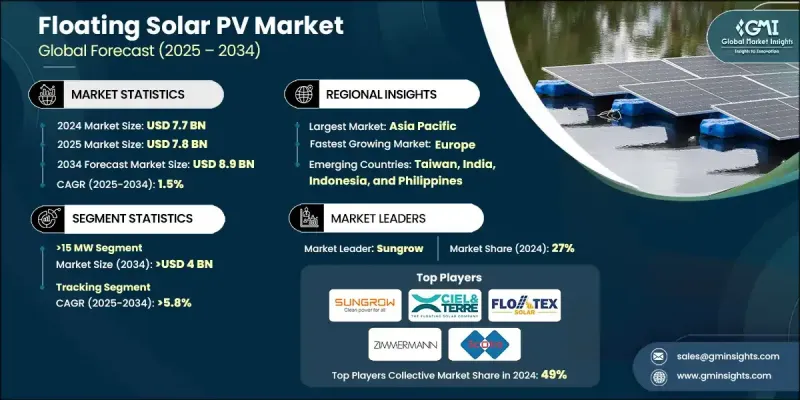
세계의 부유식 태양광발전 시장은 2024년에는 77억 달러로 평가되었고 CAGR 1.5%를 나타내 2034년에는 89억 달러에 이를 것으로 추정되고 있습니다.

꾸준한 성장의 배경으로는 호수, 저수지, 연안지대 등 토지 이용이 제한되는 수역에서 태양광 패널의 도입이 증가하고 있을 수 있습니다. 부유식 태양열 시스템은 재생가능 에너지의 생산과 특히 덥고 건조한 기후에서 증발을 억제함으로써 물을 보전하는 두 가지 이점을 제공합니다. 중동이나 아프리카 등 지역에서는 기온이 상승하고 담수 자원이 제한되어 있기 때문에 이러한 설비에 대한 수요가 높아지고 있습니다. 정부 주도의 신재생에너지 전략과 부체구조, 고정기술, 내자외선성 HDPE 등의 재료에 대한 지속적인 진보가 함께 장기적인 보급을 지지하고 있습니다. 부유식 태양열을 기존의 수력 발전 인프라 및 수처리 시설과 통합하려는 움직임도 새로운 성장 기회를 창출하고 있습니다. 동남아시아와 유럽 연안과 같은 토지는 제한되어 있지만 수역이 풍부한 지역에서는 부유식 태양열이 실행 가능하고 확장 가능한 솔루션이 되고 있습니다. 에너지 추적 시스템의 혁신과 고효율 분산 용도에 대한 관심은 시장의 장기적인 전망을 더욱 강화하고 있습니다.
| 시장 규모 | |
|---|---|
| 시작 연도 | 2024년 |
| 예측 연도 | 2025-2034년 |
| 시장 규모 | 77억 달러 |
| 예측 금액 | 89억 달러 |
| CAGR | 1.5% |
용량 5MW의 시스템 분야는 소규모 분산형 설비와의 적합성으로 인해 2034년까지 연평균 복합 성장률(CAGR) 2%를 나타낼 것으로 예측됩니다. 이러한 모듈식 솔루션은 농업 연못, 저수지, 폐수 처리 플랜트 등의 시설에 이상적입니다. 동남아시아 국가들은 청정에너지 전환을 지원하는 내륙 수역의 가용성을 활용하여 이러한 시스템을 널리 채택하고 있습니다.
추적 기술 분야는 2034년까지 연평균 복합 성장률(CAGR) 5.8%를 나타낼 것으로 예측됩니다. 이 시스템은 패널의 방향을 실시간으로 조정하여 태양에너지 흡수를 최적화하고 출력을 크게 향상시킬 수 있도록 설계되었습니다. 포르투갈이나 스페인과 같은 지역에서는 토지 이용을 지키면서 에너지 수율을 향상시키는 광범위한 이니셔티브의 일환으로 추적형 도입의 선진을 끊고 있습니다. 지속적인 기술 향상으로 추적 기능은 부유식 설비와의 궁합이 좋아지고, 공간에 제약이 있는 지역에서도 물이 풍부한 지역에서도 효율이 향상하고 있습니다.
2024년 미국의 부유식 태양광발전 시장 규모는 1,600만 달러에 달했습니다. 캘리포니아와 뉴저지와 같은 주들은 정책적인센티브와 주 전체의 지속가능성 프로그램으로의 통합을 통해 부유식 태양광발전의 채택을 장려합니다. Sungrow와 같은 기업은 적설 지역을 위한 성능 조정 등 북미 기상 조건에 맞는 태양전지 모듈을 설계하고 있습니다.
세계의 부유식 태양광발전 업계의 주요 기업으로는 Sharp Corporation, Intech Clean Energy, SolarDeck, Longi Solar, Amoy Solar Tech, Swimsol, Sungrow Group, Zimmermann PV, Ciel & Terre International, Yingli Solar, Eni Energy Solutions, Ocean Sun, Floatex Solar, Jinko Solar, Kyocera Corporation, Vikram Solar, Scotra, First Solar, China Three Gorges New Energy, Statkraft 등이 있습니다. 부유식 태양광발전 시장의 기업은 시장의 지위를 강화하기 위해 제품 혁신, 현지화, 전략적 파트너십에 초점을 맞춘 전략을 적극적으로 채택하고 있습니다. 많은 기업들이 R&D에 투자하고, 특히 해양 및 담수가 심한 환경에 대응하는 부유식 플랫폼의 내구성과 효율성을 높이고 있습니다. 지역별 규제 및 기후 요구 사항을 충족하기 위해 개별 설계 접근법이 시행되었습니다.
자주 묻는 질문
목차
제1장 조사 방법과 범위
제2장 주요 요약
제3장 업계 인사이트
- 업계 에코시스템
- 규제 상황
- 주요 부유식 태양광발전 프로젝트
- 가동중
- 앞으로의 예정
- 업계에 미치는 영향요인
- 성장 촉진요인
- 업계의 잠재적 위험 및 과제
- 성장 가능성 분석
- 비용 구조 분석
- 가격 동향 분석
- 용량별
- 지역별
- Porter's Five Forces 분석
- PESTEL 분석
제4장 경쟁 구도
- 서론
- 기업의 시장 점유율 분석 : 지역별
- 북미
- 유럽
- 아시아태평양
- 중동 및 아프리카
- 라틴아메리카
- 전략적 대시보드
- 전략적 노력
- 기업 벤치마킹
- 혁신 및 기술 상황
제5장 시장 규모·예측 : : 용량별(2021-2034년)
- 주요 동향
- <5 MW
- 5-15 MW
- >15 MW 이상
제6장 시장 규모·예측 : : 제품별(2021-2034년)
- 주요 동향
- 고정형
- 추적형
제7장 시장 규모·예측 : : 지역별(2021-2034년)
- 주요 동향
- 북미
- 미국
- 캐나다
- 유럽
- 독일
- 프랑스
- 네덜란드
- 이탈리아
- 노르웨이
- 아시아태평양
- 중국
- 일본
- 한국
- 인도
- 인도네시아
- 중동 및 아프리카
- 모로코
- 아랍에미리트(UAE)
- 라틴아메리카
- 브라질
- 라오스
제8장 기업 프로파일
- Amoy Solar Tech
- China Three Gorges New Energy
- Ciel & Terre International
- Eni Energy Solutions
- First Solar
- Floatex Solar
- Intech Clean Energy
- Jinko Solar
- Kyocera Corporation
- Longi Solar
- Ocean Sun
- Scotra
- SolarDeck
- Sungrow Power Supply
- Statkraft
- Swimsol
- Sharp Corporation
- Vikram Solar
- Yingli Solar
- Zimmermann PV
The Global Floating Solar PV Market was valued at USD 7.7 billion in 2024 and is estimated to grow at a CAGR of 1.5% to reach USD 8.9 billion by 2034.
The steady growth is attributed to the increasing deployment of solar panels over water bodies such as lakes, reservoirs, and coastal zones where land availability is constrained. Floating solar systems offer the dual benefits of renewable energy production and water conservation by reducing evaporation, especially in hot and arid climates. With rising temperatures and limited freshwater resources in areas like the Middle East and Africa, demand for these installations is increasing. Government-led renewable energy strategies, coupled with ongoing advancements in floating structures, anchoring technologies, and materials such as UV-resistant HDPE, continue to support long-term adoption. The push for integrating floating solar with existing hydropower infrastructure and water treatment facilities is also creating new growth opportunities. In regions with limited land but abundant water bodies, such as Southeast Asia and coastal Europe, floating solar is becoming a viable and scalable solution. Innovations in energy tracking systems and interest in high-efficiency, decentralized applications are further strengthening the market's long-term outlook.
| Market Scope | |
|---|---|
| Start Year | 2024 |
| Forecast Year | 2025-2034 |
| Start Value | $7.7 Billion |
| Forecast Value | $8.9 Billion |
| CAGR | 1.5% |
The Systems with a capacity of 5 MW segment is expected to grow at a CAGR of 2% through 2034, driven by their compatibility with small, distributed installations. These modular solutions are ideal for facilities such as agricultural ponds, reservoirs, and wastewater treatment plants. Countries across Southeast Asia are adopting these systems widely, capitalizing on the availability of inland water bodies to support clean energy transitions.
The tracking technologies segment is projected to grow at a CAGR of 5.8% through 2034. These systems are designed to optimize solar energy capture by adjusting panel orientation in real time, significantly improving output. Regions such as Portugal and Spain are spearheading tracking deployment as part of broader initiatives to enhance energy yield while preserving land use. With continuous technological upgrades, tracking capabilities are becoming more compatible with floating installations, boosting efficiency in space-constrained and water-abundant regions alike.
United States Floating Solar PV Market generated USD 16 million in 2024. States such as California and New Jersey are encouraging floating solar adoption through policy incentives and integration into statewide sustainability programs. Companies like Sungrow are designing solar modules tailored to North American weather conditions, including performance adjustments for snow-prone areas.
Leading players in the Global Floating Solar PV Industry include Sharp Corporation, Intech Clean Energy, SolarDeck, Longi Solar, Amoy Solar Tech, Swimsol, Sungrow Group, Zimmermann PV, Ciel & Terre International, Yingli Solar, Eni Energy Solutions, Ocean Sun, Floatex Solar, Jinko Solar, Kyocera Corporation, Vikram Solar, Scotra, First Solar, China Three Gorges New Energy, and Statkraft. Companies in the floating solar PV market are actively adopting strategies focused on product innovation, localization, and strategic partnerships to strengthen their market position. Many firms are investing in R&D to enhance the durability and efficiency of floating platforms, particularly for challenging marine and freshwater environments. Tailored design approaches are being implemented to meet region-specific regulatory and climatic requirements.
Table of Contents
Chapter 1 Methodology & Scope
- 1.1 Research design
- 1.1.1 Research approach
- 1.1.2 Data collection methods
- 1.1.3 Base estimates and calculations
- 1.1.4 Base year calculation
- 1.1.5 Key trends for market estimates
- 1.2 Forecast model
- 1.3 Primary research & validation
- 1.3.1 Primary sources
- 1.4 Data mining sources
- 1.5 Market definitions
Chapter 2 Executive Summary
- 2.1 Industry 3600 synopsis, 2021 - 2034
- 2.2 Business trends
- 2.3 Capacity trends
- 2.4 Product trends
- 2.5 Regional trends
Chapter 3 Industry Insights
- 3.1 Industry ecosystem
- 3.2 Regulatory landscape
- 3.3 Major floating solar PV projects
- 3.3.1 Operational
- 3.3.2 Upcoming
- 3.4 Industry impact forces
- 3.4.1 Growth drivers
- 3.4.2 Industry pitfalls & challenges
- 3.5 Growth potential analysis
- 3.6 Cost structure analysis
- 3.7 Price trend analysis
- 3.7.1 By capacity
- 3.7.2 By region
- 3.8 Porter's analysis
- 3.8.1 Bargaining power of suppliers
- 3.8.2 Bargaining power of buyers
- 3.8.3 Threat of new entrants
- 3.8.4 Threat of substitutes
- 3.9 PESTEL analysis
Chapter 4 Competitive landscape, 2025
- 4.1 Introduction
- 4.2 Company market share analysis, by region, 2024
- 4.2.1 North America
- 4.2.2 Europe
- 4.2.3 Asia Pacific
- 4.2.4 Middle East & Africa
- 4.2.5 Latin America
- 4.3 Strategic dashboard
- 4.4 Strategic initiatives
- 4.5 Company benchmarking
- 4.6 Innovation & technology landscape
Chapter 5 Market Size and Forecast, By Capacity, 2021 - 2034 (USD Million & MW)
- 5.1 Key trends
- 5.2 <5 MW
- 5.3 5-15 MW
- 5.4 >15 MW
Chapter 6 Market Size and Forecast, By Product, 2021 - 2034 (USD Million & MW)
- 6.1 Key trends
- 6.2 Stationary
- 6.3 Tracking
Chapter 7 Market Size and Forecast, By Region, 2021 - 2034 (USD Million & MW)
- 7.1 Key trends
- 7.2 North America
- 7.2.1 U.S.
- 7.2.2 Canada
- 7.3 Europe
- 7.3.1 Germany
- 7.3.2 France
- 7.3.3 Netherlands
- 7.3.4 Italy
- 7.3.5 Norway
- 7.4 Asia Pacific
- 7.4.1 China
- 7.4.2 Japan
- 7.4.3 South Korea
- 7.4.4 India
- 7.4.5 Indonesia
- 7.5 Middle East & Africa
- 7.5.1 Morocco
- 7.5.2 UAE
- 7.6 Latin America
- 7.6.1 Brazil
- 7.6.2 Laos
Chapter 8 Company Profiles
- 8.1 Amoy Solar Tech
- 8.2 China Three Gorges New Energy
- 8.3 Ciel & Terre International
- 8.4 Eni Energy Solutions
- 8.5 First Solar
- 8.6 Floatex Solar
- 8.7 Intech Clean Energy
- 8.8 Jinko Solar
- 8.9 Kyocera Corporation
- 8.10 Longi Solar
- 8.11 Ocean Sun
- 8.12 Scotra
- 8.13 SolarDeck
- 8.14 Sungrow Power Supply
- 8.15 Statkraft
- 8.16 Swimsol
- 8.17 Sharp Corporation
- 8.18 Vikram Solar
- 8.19 Yingli Solar
- 8.20 Zimmermann PV