|
시장보고서
상품코드
1698568
포장 라벨 시장 - 기회, 성장 촉진요인, 산업 동향 분석, 예측(2025-2034년)Packaging Labels Market Opportunity, Growth Drivers, Industry Trend Analysis, and Forecast 2025-2034 |
||||||
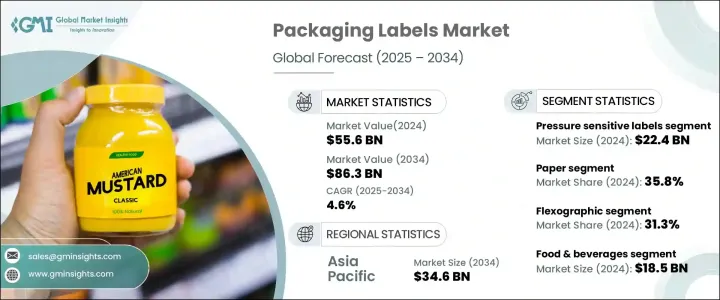
세계의 포장 라벨 시장은 2024년 556억 달러로, 2025년부터 2034년까지 CAGR 4.6%를 나타낼 것으로 예측됩니다.
전자상거래의 급속한 확대가 큰 추진력이 되어 전자기기, 식품, 패션, 의약품 등 다양한 업계의 포장 라벨 수요를 부추기고 있습니다. 이를 줄이기 위해 업계는 지속 가능한 라벨링 솔루션으로 전환하고 있습니다. 재사용 가능하고 친횐경적인 패키징이 보급되고 있으며, 기업은 재활용 가능한 소재를 통합하고 스마트 라벨링 기술을 채택하여 제품의 추적 성과 소비자의 관심을 높입니다.

이 시장은 점착 라벨, 수축 라벨, 스트레치 라벨, 젖은 접착 라벨 등 라벨 유형별로 구분됩니다. 점착 라벨은 2024년에 224억 달러를 차지하며 업계 전반에 대한 적응성이 높아지면서 널리 사용되고 있습니다. 수축 라벨은 2034년까지 229억 달러에 달할 것으로 예상되며, 복잡한 포장 모양에 맞게 브랜딩을 완전히 커버하는 능력에서 선호됩니다. CAGR 4.3%로 성장하는 스트레치 라벨은 일반적으로 변조 방지 포장에 사용되며, 2034년까지 89억 달러에 달할 것으로 예상되는 습식 접착제 라벨은 고급 식품과 음식에 인기가 있습니다. RFID 및 디지털 인쇄 기술과 통합된 스마트 라벨의 채택은 브랜딩, 인증 및 추적성을 더욱 강화하고 있습니다.
| 시장 범위 | |
|---|---|
| 시작 연도 | 2024년 |
| 예측 연도 | 2025-2034년 |
| 시작 금액 | 556억 달러 |
| 예측 금액 | 863억 달러 |
| CAGR | 4.6% |
재료 유형별로 시장은 종이, 플라스틱, 금속 라벨로 분류됩니다. 2024년 시장 점유율은 종이 라벨이 35.8%를 차지하고 플라스틱 대체품으로의 이동을 반영합니다. 플라스틱 라벨은 CAGR 5.1%로 성장하여 지속가능성 목표에 맞게 생분해성 소재를 도입하고 있습니다. 2034년까지 91억 달러에 이를 것으로 예상되는 금속 라벨은 지속성과 가혹한 환경 조건에 대한 내성으로 인해 수요가 계속되고 있습니다.
인쇄 기술의 진보가 업계를 재구성하고 있습니다. 플렉소 인쇄는 2024년에 31.3% 시장 점유율을 차지해 고속 대량 생산을 위한 주요한 선택지로 계속되고 있습니다. CAGR 4.8%로 성장하는 디지털 인쇄는 단납기 생산과 커스터마이즈에 대응하는 한편, 2034년까지 48억 달러에 이를 것으로 예측되는 오프셋 인쇄는 아직 중규모에서 대규모 인쇄에 적합한 선택사항입니다.
식음료, 의약품, 소비재, 자동차 등의 최종 이용 산업이 시장 확대를 견인하고 있습니다. 식음료 분야는 엄격한 라벨링 규제가 수요를 높이고 있어, 2024년 시장 규모는 185억 달러에 달했습니다. 2034년에는 128억 달러에 달할 것으로 예상되는 소비재는 미관과 정보성이 높은 라벨링에 주력하고 있습니다.
아시아태평양이 시장을 독점하고 2034년까지 346억 달러에 이를 것으로 예상됩니다.
목차
제1장 조사 방법과 조사 범위
- 시장 범위와 정의
- 기본 추정과 계산
- 예측 파라미터
- 데이터 소스
제2장 주요 요약
제3장 업계 인사이트
- 생태계 분석
- 벤더 매트릭스
- 기술과 혁신의 전망
- 특허 분석
- 주요 뉴스와 이니셔티브
- 규제 상황
- 영향요인
- 성장 촉진요인
- 전자상거래 분야의 성장
- 지속 가능한 포장에 대한 소비자의 선호도 증가
- 기술의 진보
- 규제 요건
- 식음료 업계의 성장
- 업계의 잠재적 위험 및 과제
- 환경에 대한 우려
- 규제상의 제약
- 성장 촉진요인
- 성장 가능성 분석
- Porter's Five Forces 분석
- PESTEL 분석
제4장 경쟁 구도
- 기업 점유율 분석
- 경쟁 포지셔닝 매트릭스
- 전략 전망 매트릭스
제5장 시장 추계 및 예측 : 라벨 유형별, 2021-2032년
- 주요 동향
- 점착 라벨
- 수축 라벨
- 스트레치 라벨
- 젖은 접착 라벨
- 기타
제6장 시장 추계 및 예측 : 재료별, 2021-2032년
- 주요 동향
- 종이
- 플라스틱
- 금속
- 기타
제7장 시장 추계 및 예측 : 인쇄 기술별, 2021-2032년
- 주요 동향
- 플렉소 인쇄
- 그라비아
- 디지털 인쇄
- 오프셋 인쇄
- 하이브리드 인쇄
제8장 시장 추계 및 예측 : 용도별, 2021-2032년
- 주요 동향
- 식음료
- 베이커리 및 과자류
- 유제품
- 냉동식품
- 알코올
- 비알코올
- 기타
- 의약품
- 정제 및 캡슐
- 크림 및 연고
- 액체 시럽
- 기타
- 소비재
- 화학제품
- 자동차
- 공업
- 기타
제9장 시장 추계 및 예측 : 지역별, 2021-2032년
- 주요 동향
- 북미
- 미국
- 캐나다
- 유럽
- 영국
- 독일
- 프랑스
- 이탈리아
- 스페인
- 기타 유럽
- 아시아태평양
- 중국
- 인도
- 일본
- 한국
- 뉴질랜드
- 기타 아시아태평양
- 라틴아메리카
- 브라질
- 멕시코
- 기타 라틴아메리카
- 중동 및 아프리카
- UAE
- 사우디아라비아
- 남아프리카
- 기타 중동 및 아프리카
제10장 기업 프로파일
- 3M Company
- Amcor plc
- Anchor Printing
- Avery Dennison Corporation
- Berry Global
- CCL Industries Inc.
- Constantia Flexibles Group GmbH
- Coveris Holding SA
- Fort Dearborn Company
- Fuji Seal International, Inc.
- HERMA GmbH
- Honeywell International Inc.
- Huhtamaki Group
- ID Images
- Klöckner Pentaplast Europe GmbH &Co KG
- KRIS FLEXIPACKS PVT. LTD.
- Lintec Corporation
- Mondi Plc
- Multi-Color Corporation
- Neenah, Inc
- Resource Label Group, LLC
- Sato Holdings Corporation
- Taghleef Industries Inc.
- UPM Raflatac
- WestRock Company
The Global Packaging Labels Market was valued at USD 55.6 billion in 2024 and is expected to grow at a CAGR of 4.6% from 2025 to 2034. The rapid expansion of e-commerce is a significant driver, fueling the demand for packaging labels across various industries, including electronics, food, fashion, and pharmaceuticals. As online retail expands, the need for clear, durable, and regulatory-compliant labeling continues to rise. The industry is also shifting towards sustainable labeling solutions as companies aim to reduce their carbon footprint. Reusable and eco-friendly packaging is becoming more prevalent, with businesses integrating recyclable materials and adopting smart labeling technologies to enhance product traceability and consumer engagement.
The market is segmented by label type, including pressure-sensitive labels, shrink labels, stretch labels, and wet glue labels. Pressure-sensitive labels accounted for USD 22.4 billion in 2024 and continue to be widely used due to their adaptability across industries. Shrink labels, projected to reach USD 22.9 billion by 2034, are preferred for their ability to conform to complex packaging shapes, offering full branding coverage. Stretch labels, growing at a CAGR of 4.3%, are commonly used for tamper-evident packaging, while wet glue labels, expected to reach USD 8.9 billion by 2034, are popular in premium food and beverage products. The adoption of smart labels integrated with RFID and digital printing technologies is further enhancing branding, authentication, and traceability.
| Market Scope | |
|---|---|
| Start Year | 2024 |
| Forecast Year | 2025-2034 |
| Start Value | $55.6 Billion |
| Forecast Value | $86.3 Billion |
| CAGR | 4.6% |
By material type, the market is classified into paper, plastic, and metal labels. Paper labels held a 35.8% market share in 2024, reflecting a shift toward plastic-free alternatives. Plastic labels, growing at a CAGR of 5.1%, are incorporating biodegradable materials to align with sustainability goals. Metal labels, anticipated to reach USD 9.1 billion by 2034, remain in demand for their durability and resistance to harsh environmental conditions.
Advancements in printing technology are reshaping the industry. Flexographic printing, holding a 31.3% market share in 2024, remains the leading choice for high-speed, large-volume production. Rotogravure printing is expected to reach USD 20.9 billion by 2034 due to its superior image quality and color consistency. Digital printing, growing at a CAGR of 4.8%, supports shorter production runs and customization, while offset printing, projected to reach USD 4.8 billion by 2034, remains a preferred option for medium to large-scale printing. Hybrid printing, combining traditional and digital techniques, is expanding at a CAGR of 2.6%.
End-use industries such as food and beverages, pharmaceuticals, consumer goods, and automotive are driving market expansion. The food and beverage segment was valued at USD 18.5 billion in 2024, with stringent labeling regulations enhancing demand. The pharmaceutical industry, growing at a CAGR of 6.2%, is leveraging smart labels for improved product authentication and traceability. Consumer goods, projected to reach USD 12.8 billion by 2034, are focusing on aesthetic and informative labeling. The automotive and industrial sectors are increasingly integrating RFID solutions for inventory tracking and supply chain management.
Asia Pacific is set to dominate the market, reaching USD 34.6 billion by 2034. The region's booming e-commerce sector and adoption of smart labeling solutions are key growth factors. The demand for sustainable packaging solutions continues to drive innovation, shaping the future of the global packaging labels market.
Table of Contents
Chapter 1 Methodology & Scope
- 1.1 Market scope & definition
- 1.2 Base estimates & calculations
- 1.3 Forecast parameters
- 1.4 Data sources
- 1.4.1 Primary
- 1.4.2 Secondary
- 1.4.2.1 Paid sources
- 1.4.2.2 Public sources
Chapter 2 Executive Summary
- 2.1 Industry 3600 synopsis, 2021 - 2032
Chapter 3 Industry Insights
- 3.1 Industry ecosystem analysis
- 3.2 Vendor matrix
- 3.3 Technology & innovation landscape
- 3.4 Patent analysis
- 3.5 Key news and initiatives
- 3.6 Regulatory landscape
- 3.7 Impact forces
- 3.7.1 Growth drivers
- 3.7.1.1 Growing E-Commerce sector
- 3.7.1.2 Rising consumer preference for sustainable packaging
- 3.7.1.3 Technological advancements
- 3.7.1.4 Regulatory requirements
- 3.7.1.5 Growth in the food and beverage industry
- 3.7.2 Industry pitfalls & challenges
- 3.7.2.1 Environmental concerns
- 3.7.2.2 Regulatory restrictions
- 3.7.1 Growth drivers
- 3.8 Growth potential analysis
- 3.9 Porter's analysis
- 3.9.1 Supplier power
- 3.9.2 Buyer power
- 3.9.3 Threat of new entrants
- 3.9.4 Threat of substitutes
- 3.9.5 Industry rivalry
- 3.10 PESTEL analysis
Chapter 4 Competitive Landscape, 2023
- 4.1 Company market share analysis
- 4.2 Competitive positioning matrix
- 4.3 Strategic outlook matrix
Chapter 5 Market Estimates & Forecast, By Label Type, 2021 - 2032 (USD Million)
- 5.1 Key trends
- 5.2 Pressure sensitive labels
- 5.3 Shrink labels
- 5.4 Stretch labels
- 5.5 Wet glue labels
- 5.6 Others
Chapter 6 Market Estimates & Forecast, By Material, 2021 – 2032 (USD Million)
- 6.1 Key trends
- 6.2 Paper
- 6.3 Plastic
- 6.4 Metal
- 6.5 Others
Chapter 7 Market Estimates & Forecast, By Printing Technology, 2021 – 2032 (USD Million)
- 7.1 Key trends
- 7.2 Flexographic
- 7.3 Rotogravure/Gravure
- 7.4 Digital printing
- 7.5 Offset printing
- 7.6 Hybrid printing
Chapter 8 Market Estimates & Forecast, By End-Use, 2021 – 2032 (USD Million)
- 8.1 Key trends
- 8.2 Food & beverages
- 8.2.1 Bakery & confectionery
- 8.2.2 Dairy products
- 8.2.3 Frozen food
- 8.2.4 Alcoholic
- 8.2.5 Non-Alcoholic
- 8.2.6 Others
- 8.3 Pharmaceutical
- 8.3.1 Tablet/Capsules
- 8.3.2 Cream & ointment
- 8.3.3 Liquid syrup
- 8.3.4 Others
- 8.4 Consumer goods
- 8.5 Chemicals
- 8.6 Automotive
- 8.7 Industrial
- 8.8 Others
Chapter 9 Market Estimates & Forecast, By Region, 2021 - 2032 (USD Million)
- 9.1 Key trends
- 9.2 North America
- 9.2.1 U.S.
- 9.2.2 Canada
- 9.3 Europe
- 9.3.1 UK
- 9.3.2 Germany
- 9.3.3 France
- 9.3.4 Italy
- 9.3.5 Spain
- 9.3.6 Rest of Europe
- 9.4 Asia Pacific
- 9.4.1 China
- 9.4.2 India
- 9.4.3 Japan
- 9.4.4 South Korea
- 9.4.5 ANZ
- 9.4.6 Rest of Asia Pacific
- 9.5 Latin America
- 9.5.1 Brazil
- 9.5.2 Mexico
- 9.5.3 Rest of Latin America
- 9.6 MEA
- 9.6.1 UAE
- 9.6.2 Saudi Arabia
- 9.6.3 South Africa
- 9.6.4 Rest of MEA
Chapter 10 Company Profiles
- 10.1 3M Company
- 10.2 Amcor plc
- 10.3 Anchor Printing
- 10.4 Avery Dennison Corporation
- 10.5 Berry Global
- 10.6 CCL Industries Inc.
- 10.7 Constantia Flexibles Group GmbH
- 10.8 Coveris Holding S.A.
- 10.9 Fort Dearborn Company
- 10.10 Fuji Seal International, Inc.
- 10.11 HERMA GmbH
- 10.12 Honeywell International Inc.
- 10.13 Huhtamaki Group
- 10.14 ID Images
- 10.15 Klöckner Pentaplast Europe GmbH & Co KG
- 10.16 KRIS FLEXIPACKS PVT. LTD.
- 10.17 Lintec Corporation
- 10.18 Mondi Plc
- 10.19 Multi-Color Corporation
- 10.20 Neenah, Inc
- 10.21 Resource Label Group, LLC
- 10.22 Sato Holdings Corporation
- 10.23 Taghleef Industries Inc.
- 10.24 UPM Raflatac
- 10.25 WestRock Company