


|
시장보고서
상품코드
1699303
단상 분로 리액터 시장 기회, 성장 촉진요인, 산업 동향 분석, 예측(2025-2034년)Single Phase Shunt Reactor Market Opportunity, Growth Drivers, Industry Trend Analysis, and Forecast 2025-2034 |
||||||
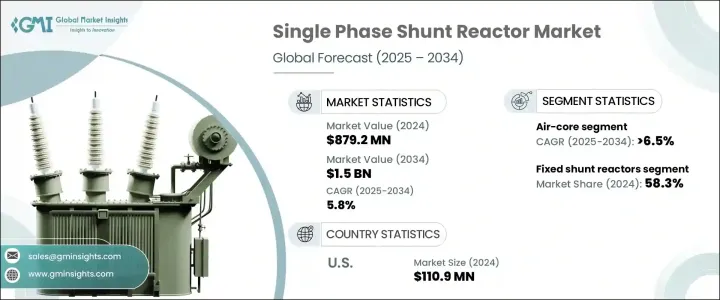
세계의 단상 분로 리액터 시장은 2024년에 8억 7,920만 달러에 이르렀으며, 스마트 그리드와 디지털 변전소에 대한 투자 증가로 2025년부터 2034년까지 연평균 복합 성장률(CAGR) 5.8%를 나타낼 것으로 예측되고 있습니다.
효율적인 에너지 트랜스미션과 그리드 안정성 향상에 대한 수요 증가가 최신 전력 네트워크에서 이러한 반응기의 보급에 박차를 가하고 있습니다. 전력 회사와 계통 운영자가 전력 품질 최적화에 주력하는 동안, 단상 분로 리액터는 전압 안정화 및 전력 손실 감소에 중요한 역할을 합니다.
시장 확대의 주요 요인은 풍력 발전 및 태양광 발전을 포함한 신재생 에너지원의 도입이 증가하고 있다는 것이며, 원활한 전력 통합을 보장하기 위해 고급 그리드 관리 솔루션이 필요합니다. 산업·주택 분야에서의 전기 추진의 고조는 신뢰성이 높고 효율적인 송전 시스템에 수요를 한층 더 높이고 있습니다. 세계 각국의 정부는 지속가능성 목표를 지원하기 위해 에너지 인프라를 강화하고 있으며 고압 송전 네트워크에 대한 투자 확대로 이어지고 있습니다. 전력 부문이 자동화와 디지털화를 채용하는 중, 스마트 변전소의 채용이 가속되고 있어 시장 관계자에게 새로운 기회가 탄생하고 있습니다. 게다가 IoT 기반 감시 시스템과 AI 주도의 그리드 분석 등의 신기술이 운영 효율성을 높이고 있으며, 단상 분로 리액터가 현대의 에너지 네트워크에 있어서 보다 필수적이 되고 있습니다.
| 시장 범위 | |
|---|---|
| 시작 연도 | 2024년 |
| 예측 연도 | 2025-2034년 |
| 시작 금액 | 8억 7,920만 달러 |
| 예측 금액 | 15억 달러 |
| CAGR | 5.8% |
시장은 절연 기술의 진보의 혜택을 받고 있으며, 유침형과 공심형이 큰 견인력이 되고 있습니다. 용도에 선호되는 옵션이 되고 있으며, 이러한 리액터는 송전망의 안정성을 높일 뿐만 아니라 송전의 전반적인 효율을 향상시키고 현대의 전력 인프라에서 중요한 역할을 강화하고 있습니다.
시장 세분화는 제품 유형별로 고정형 및 가변형 단상 분로 리액터를 포함하고 있습니다. 유연하게 대응할 수 있는 가변 단상 분로 리액터에 대한 관심을 높이고 있습니다.이러한 첨단 솔루션은 전력 사용의 최적화, 트랜스미션 손실의 최소화, 전체적인 그리드 적응성의 향상에 도움이 됩니다.
미국의 단상 분로 리액터 시장은 2024년에 1억 1,090만 달러에 이르렀으며 연방 정부의 이니셔티브가 송전망의 신뢰성 강화에 중점을 두고 있기 때문에 확대가 계속되고 있습니다. 인프라의 근대화, 에너지 효율의 중시의 고조가 추풍이 되고 있습니다. 전력회사가 송전망의 성능을 향상시켜, 안정된 전력 공급을 확보하려고 하고 있기 때문에 고도의 전력 관리 솔루션에 대한 수요는 계속 견조하고, 단상 분로 리액터는 이 지역의 진화하는 에너지 정세에 있어서의 중요한 구성 요소로서 자리매김되고 있습니다.
목차
제1장 조사 방법과 조사 범위
- 시장의 정의
- 기본 추정과 계산
- 예측 계산
- 데이터 소스
제2장 주요 요약
제3장 업계 인사이트
- 생태계 분석
- 규제 상황
- 업계에 미치는 영향요인
- 성장 촉진요인
- 업계의 잠재적 위험 및 과제
- 성장 가능성 분석
- Porter's Five Forces 분석
- PESTEL 분석
제4장 경쟁 구도
- 전략 대시보드
- 혁신과 지속가능성의 전망
제5장 시장 규모와 예측 : 단열재별(2021-2034년)
- 주요 동향
- 오일 침지
- 에어 코어
제6장 시장 규모와 예측 : 제품별(2021-2034년)
- 주요 동향
- 고정 분로 리액터
- 가변 분로 리액터
제7장 시장 규모와 예측 : 최종 용도별(2021-2034년)
- 주요 동향
- 전기 유틸리티
- 재생에너지
제8장 시장 규모와 예측 : 지역별(2021-2034년)
- 주요 동향
- 북미
- 미국
- 캐나다
- 유럽
- 영국
- 독일
- 프랑스
- 이탈리아
- 러시아
- 아시아태평양
- 중국
- 인도
- 일본
- 호주
- 중동 및 아프리카
- 사우디아라비아
- 아랍에미리트(UAE)
- 카타르
- 남아프리카
- 라틴아메리카
- 브라질
- 아르헨티나
제9장 기업 프로파일
- CG Power &Industrial Solutions
- Fuji Electric
- GE
- GBE
- GETRA
- HICO America
- Hitachi Energy
- Hyosung Heavy Industries
- Nissin Electric
- SGB SMIT
- Siemens Energy
- Shrihans Electricals
- Toshiba Energy Systems &Solutions
- TMC Transformers Manufacturing Company
- WEG
The Global Single-Phase Shunt Reactor Market reached USD 879.2 million in 2024 and is projected to expand at a CAGR of 5.8% from 2025 to 2034, driven by increasing investments in smart grids and digital substations. The rising demand for efficient energy transmission and enhanced grid stability is fueling the widespread adoption of these reactors across modern power networks. As utilities and grid operators focus on optimizing power quality, single-phase shunt reactors are playing a crucial role in voltage stabilization and reducing power losses.
A key factor driving market expansion is the increasing deployment of renewable energy sources, including wind and solar power, which require advanced grid management solutions to ensure seamless power integration. The growing push for electrification in the industrial and residential sectors is further amplifying the demand for reliable and efficient power transmission systems. Governments worldwide are strengthening their energy infrastructure to support sustainability goals, leading to greater investments in high-voltage transmission networks. With the power sector embracing automation and digitalization, the adoption of smart substations is accelerating, creating new opportunities for market players. Additionally, emerging technologies such as IoT-based monitoring systems and AI-driven grid analytics are enhancing operational efficiency, making single-phase shunt reactors more indispensable for modern energy networks.
| Market Scope | |
|---|---|
| Start Year | 2024 |
| Forecast Year | 2025-2034 |
| Start Value | $879.2 Million |
| Forecast Value | $1.5 Billion |
| CAGR | 5.8% |
The market continues to benefit from advancements in insulation technologies, with oil-immersed and air-core variants gaining significant traction. Oil-immersed shunt reactors are witnessing increasing demand due to their superior cooling capabilities and long operational life, making them a preferred choice for high-voltage applications. These reactors not only enhance grid stability but also improve the overall efficiency of power transmission, reinforcing their critical role in modern electricity infrastructure.
Segmented by product type, the market includes fixed and variable single-phase shunt reactors. In 2024, fixed shunt reactors accounted for 58.3% of the total market share and are expected to see continued growth due to their widespread application in transmission networks. However, utilities are increasingly turning toward variable single-phase shunt reactors, which offer greater flexibility to adjust to fluctuating grid conditions. These advanced solutions help optimize power usage, minimize transmission losses, and enhance overall grid adaptability. With growing concerns about voltage stability and efficient energy distribution, the adoption of variable reactors is set to rise significantly in the coming years.
The U.S. single-phase shunt reactor market reached USD 110.9 million in 2024 and continues to expand as federal initiatives focus on strengthening grid reliability. The nation's push toward smart grids and high-voltage transmission systems is fueling market growth, supported by large-scale investments in renewable energy integration. The broader North American market is benefiting from industrial expansion, infrastructure modernization, and increasing emphasis on energy efficiency. As utilities seek to enhance grid performance and ensure a stable power supply, the demand for advanced power management solutions remains robust, positioning single-phase shunt reactors as a key component in the region's evolving energy landscape.
Table of Contents
Chapter 1 Methodology & Scope
- 1.1 Market definitions
- 1.2 Base estimates & calculations
- 1.3 Forecast calculation
- 1.4 Data sources
- 1.4.1 Primary
- 1.4.2 Secondary
- 1.4.2.1 Paid
- 1.4.2.2 Public
Chapter 2 Executive Summary
- 2.1 Industry synopsis, 2021 - 2034
Chapter 3 Industry Insights
- 3.1 Industry ecosystem analysis
- 3.2 Regulatory landscape
- 3.3 Industry impact forces
- 3.3.1 Growth drivers
- 3.3.2 Industry pitfalls & challenges
- 3.4 Growth potential analysis
- 3.5 Porter's analysis
- 3.5.1 Bargaining power of suppliers
- 3.5.2 Bargaining power of buyers
- 3.5.3 Threat of new entrants
- 3.5.4 Threat of substitutes
- 3.6 PESTEL analysis
Chapter 4 Competitive Landscape, 2024
- 4.1 Strategic dashboard
- 4.2 Innovation & sustainability landscape
Chapter 5 Market Size and Forecast, By Insulation, 2021 – 2034 (USD Million)
- 5.1 Key trends
- 5.2 Oil immersed
- 5.3 Air core
Chapter 6 Market Size and Forecast, By Product, 2021 – 2034 (USD Million)
- 6.1 Key trends
- 6.2 Fixed shunt reactors
- 6.3 Variable shunt reactors
Chapter 7 Market Size and Forecast, By End Use, 2021 – 2034 (USD Million)
- 7.1 Key trends
- 7.2 Electric utility
- 7.3 Renewable energy
Chapter 8 Market Size and Forecast, By Region, 2021 – 2034 (USD Million)
- 8.1 Key trends
- 8.2 North America
- 8.2.1 U.S.
- 8.2.2 Canada
- 8.3 Europe
- 8.3.1 UK
- 8.3.2 Germany
- 8.3.3 France
- 8.3.4 Italy
- 8.3.5 Russia
- 8.4 Asia Pacific
- 8.4.1 China
- 8.4.2 India
- 8.4.3 Japan
- 8.4.4 Australia
- 8.5 Middle East & Africa
- 8.5.1 Saudi Arabia
- 8.5.2 UAE
- 8.5.3 Qatar
- 8.5.4 South Africa
- 8.6 Latin America
- 8.6.1 Brazil
- 8.6.2 Argentina
Chapter 9 Company Profiles
- 9.1 CG Power & Industrial Solutions
- 9.2 Fuji Electric
- 9.3 GE
- 9.4 GBE
- 9.5 GETRA
- 9.6 HICO America
- 9.7 Hitachi Energy
- 9.8 Hyosung Heavy Industries
- 9.9 Nissin Electric
- 9.10 SGB SMIT
- 9.11 Siemens Energy
- 9.12 Shrihans Electricals
- 9.13 Toshiba Energy Systems & Solutions
- 9.14 TMC Transformers Manufacturing Company
- 9.15 WEG
