


|
시장보고서
상품코드
1708188
스마트 정형외과 임플란트 시장 기회, 성장 촉진요인, 산업 동향 분석 및 예측(2025-2034년)Smart Orthopedic Implants Market Opportunity, Growth Drivers, Industry Trend Analysis, and Forecast 2025 - 2034 |
||||||
스마트 정형외과 임플란트 세계 시장은 2024년 22억 달러로 평가되었고, 2025년부터 2034년까지 연평균 17.3% 성장할 것으로 예측됩니다.
스마트 정형외과 임플란트는 근골격계 상태를 모니터링하고 진단하며 치료 결과를 향상시키는 센서와 연결 기능을 갖춘 혁신적인 의료기기입니다. 이러한 임플란트는 하중, 정렬, 치유 과정과 같은 측정 기준에 대한 실시간 데이터를 제공하여 환자 맞춤형 치료를 가능하게 하고 치료 효율을 향상시킵니다. 개인 맞춤형 의료에 대한 수요 증가는 기술 발전과 함께 이러한 임플란트의 채택을 촉진하고 시장의 상당한 성장에 기여하고 있습니다. 근골격계 질환 증가와 노령 인구 증가는 수요를 더욱 부추기고 있습니다. 골관절염, 골다공증, 골절 등의 치료는 고령화, 좌식 생활습관, 비만 등으로 인해 점점 더 흔해져 효과적인 치료 솔루션의 필요성이 높아지고 있습니다.
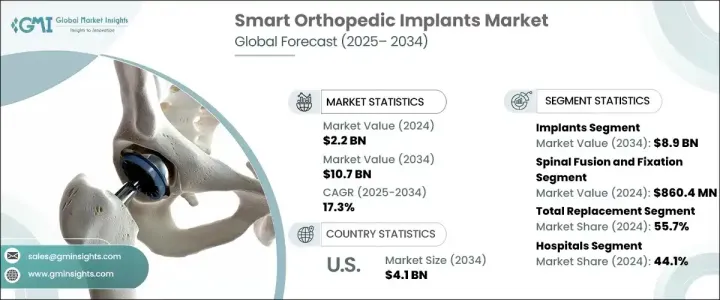
시장은 부품별로 분류되며, 임플란트와 전자 부품이 주요 카테고리입니다. 임플란트는 2024년 시장 수익의 83.4%를 차지하고 2034년에는 89억 달러에 달했습니다. 이러한 임플란트, 특히 인공 슬관절과 인공 고관절은 뼈의 퇴행성 질환을 치료하는 데 널리 사용되어 시장 우위를 주도하고 있습니다. 센서 및 인공지능(AI)과 같은 첨단 기술의 통합은 임플란트의 성능을 향상시켜 더 나은 환자 결과와 더 높은 채택률로 이어지고 있습니다.
| 시장 범위 | |
|---|---|
| 시작 연도 | 2024년 |
| 예측 연도 | 2025-2034년 |
| 시작 금액 | 22억 달러 |
| 예상 금액 | 107억 달러 |
| CAGR | 17.3% |
용도별로는 스마트 정형외과 임플란트 시장에는 척추 고정, VCF 치료, 운동 보존/비고정, 척추 제압이 포함됩니다. 척추 고정술과 고정술은 2024년 8억 6,040만 달러 규모로 시장을 장악했습니다. 이 시술은 추간판탈출증, 척추측만증, 척추관협착증 치료에 일반적으로 사용되며, 특히 고령화 시대에 더욱 많이 사용되고 있습니다. 실시간 모니터링용 센서의 통합과 고정 기술의 향상으로 이러한 시술의 효능이 강화되어 시장을 선도하고 있습니다.
시술 유형에 따라 전체 치환술, 부분 치환술, 기타 시술로 나뉩니다. 인공관절 전치환술이 2024년 매출 점유율 55.7%를 차지했고, 2034년 59억 달러에 달할 것으로 예측됩니다. 퇴행성 관절 질환의 발병률 증가와 인구 고령화가 특히 무릎 관절 전치환술에 대한 수요를 주도하고 있습니다. 이러한 인공관절 치환술은 심각한 관절 질환에 대한 종합적인 솔루션을 제공하고, 더 나은 기능성과 장기적인 치료 효과를 제공하기 때문에 시장 지배력을 강화하고 있습니다.
최종 용도에 따라 시장은 병원, 외래수술센터(ASC), 전문 클리닉, 기타 시설로 분류됩니다. 병원은 복잡한 수술을 관리하고 종합적인 수술 후 관리를 제공할 수 있는 능력으로 인해 2024년 44.1%의 가장 큰 매출 점유율을 차지할 것으로 예측됩니다. 고급 수술 능력, 전문 장비, 다학제적 치료로 인해 스마트 임플란트를 포함한 정형외과 수술에 선호되고 있습니다.
미국의 스마트 정형외과 임플란트 시장은 2023년 7억 4,850만 달러 규모에서 2034년 41억 달러로 크게 성장할 것으로 예측됩니다. 미국은 헬스케어 혁신에 중점을 두고 있으며, 탄탄한 인프라, 광범위한 보험 적용, 최첨단 정형외과 솔루션에 대한 인식이 높아지면서 다양한 환자층에서 스마트 정형외과 임플란트 채택을 촉진하고 있습니다.
목차
제1장 조사 방법과 조사 범위
제2장 주요 요약
제3장 업계 인사이트
- 생태계 분석
- 업계에 대한 영향요인
- 성장 촉진요인
- 업계의 잠재적 리스크&과제
- 성장 가능성 분석
- 규제 상황
- 향후 시장 동향
- 갭 분석
- 기술적 전망
- Porter's Five Forces 분석
- PESTEL 분석
제4장 경쟁 구도
- 서론
- 기업 점유율 분석
- 기업 매트릭스 분석
- 주요 시장 기업 - 경쟁 분석
- 경쟁 포지셔닝 매트릭스
- 전략 대시보드
제5장 시장 추산 및 예측 : 컴포넌트별, 2021년-2034년
- 주요 동향
- 임플란트
- 인공 슬관절 치환술
- 인공 고관절 치환술
- 척추 고정술
- 골절 고정
- 기타 임플란트
- 전자부품
제6장 시장 추산 및 예측 : 용도별, 2021년-2034년
- 주요 동향
- 척추 고정
- VCF 치료
- 운동 온존/비고정
- 척추 감압술
제7장 시장 추산 및 예측 : 시술 유형별, 2021년-2034년
- 주요 동향
- 전치환술
- 부분 치환술
- 기타 시술 유형
제8장 시장 추산 및 예측 : 최종 용도별, 2021년-2034년
- 주요 동향
- 병원
- 외래수술센터(ASC)
- 전문 클리닉
- 기타 최종 용도
제9장 시장 추산 및 예측 : 지역별, 2021년-2034년
- 주요 동향
- 북미
- 미국
- 캐나다
- 유럽
- 독일
- 영국
- 프랑스
- 스페인
- 이탈리아
- 네덜란드
- 아시아태평양
- 중국
- 인도
- 일본
- 호주
- 한국
- 라틴아메리카
- 브라질
- 멕시코
- 아르헨티나
- 중동 및 아프리카
- 사우디아라비아
- 남아프리카공화국
- 아랍에미리트(UAE)
제10장 기업 개요
- Canary Medical
- Exactech
- Medtronic
- SpineGuard
- Stryker
- Zimmer Biomet
The Global Smart Orthopedic Implants Market was valued at USD 2.2 billion in 2024 and is expected to grow at a CAGR of 17.3% from 2025 to 2034. Smart orthopedic implants are innovative medical devices equipped with sensors and connectivity features that monitor, diagnose, and enhance treatment outcomes for musculoskeletal conditions. These implants offer real-time data on metrics such as load, alignment, and healing progress, enabling personalized patient care and improving treatment efficiency. Increasing demand for personalized healthcare, coupled with advancements in technology, is driving the adoption of these implants, contributing to significant market growth. Rising cases of musculoskeletal disorders and a growing geriatric population further fuel the demand. Conditions such as osteoarthritis, osteoporosis, and fractures are becoming increasingly common due to aging, sedentary lifestyles, and obesity, boosting the need for effective treatment solutions.

The market is segmented based on components, with implants and electronic components as the primary categories. Implants accounted for 83.4% of the market revenue in 2024 and are projected to reach USD 8.9 billion by 2034. These implants, particularly for knee and hip replacements, are widely used to treat degenerative bone conditions, which drives their market dominance. The integration of advanced technologies like sensors and artificial intelligence (AI) enhances implant performance, leading to better patient outcomes and greater adoption rates.
| Market Scope | |
|---|---|
| Start Year | 2024 |
| Forecast Year | 2025-2034 |
| Start Value | $2.2 Billion |
| Forecast Value | $10.7 Billion |
| CAGR | 17.3% |
By application, the smart orthopedic implants market includes spinal fusion and fixation, VCF treatment, motion preservation/non-fusion, and spinal decompression. Spinal fusion and fixation dominated the market with a value of USD 860.4 million in 2024. These procedures are commonly used to treat herniated discs, scoliosis, and spinal stenosis, particularly among the aging population. The integration of sensors for real-time monitoring and improved fixation techniques enhances the effectiveness of these procedures, ensuring their continued market leadership.
When segmented by procedure type, the market includes total replacement, partial replacement, and other procedures. Total replacement emerged as the dominant segment, accounting for 55.7% of the revenue share in 2024, and is estimated to reach USD 5.9 billion by 2034. The rising incidence of degenerative joint diseases and an aging population drive the demand for total replacement procedures, particularly for knee joints. These procedures provide comprehensive solutions for severe joint conditions, offering better functionality and long-term relief, which reinforces their market dominance.
Based on end use, the market is segmented into hospitals, ambulatory surgical centers, specialty clinics, and other facilities. Hospitals held the largest revenue share of 44.1% in 2024 due to their capability to manage complex surgeries and provide comprehensive post-operative care. Their advanced surgical capabilities, specialized equipment, and multidisciplinary care make them the preferred choice for orthopedic procedures involving smart implants.
In the United States, the smart orthopedic implants market accounted for USD 748.5 million in 2023 and is expected to grow significantly, reaching USD 4.1 billion by 2034. The country's emphasis on healthcare innovation, robust infrastructure, widespread insurance coverage, and increasing awareness of cutting-edge orthopedic solutions drive the adoption of smart orthopedic implants across diverse patient demographics.
Table of Contents
Chapter 1 Methodology and Scope
- 1.1 Market scope and definitions
- 1.2 Research design
- 1.2.1 Research approach
- 1.2.2 Data collection methods
- 1.3 Base estimates and calculations
- 1.3.1 Base year calculation
- 1.3.2 Key trends for market estimation
- 1.4 Forecast model
- 1.5 Primary research and validation
- 1.5.1 Primary sources
- 1.5.2 Data mining sources
Chapter 2 Executive Summary
- 2.1 Industry 3600 synopsis
Chapter 3 Industry Insights
- 3.1 Industry ecosystem analysis
- 3.2 Industry impact forces
- 3.2.1 Growth drivers
- 3.2.1.1 Growing prevalence of musculoskeletal disorders
- 3.2.1.2 Rising geriatric population in developed as well as developing economies
- 3.2.1.3 Shift towards personalized medicine
- 3.2.1.4 Technological advancements in the field of smart implants
- 3.2.2 Industry pitfalls and challenges
- 3.2.2.1 Stringent regulatory framework
- 3.2.2.2 High cost of implants
- 3.2.1 Growth drivers
- 3.3 Growth potential analysis
- 3.4 Regulatory landscape
- 3.5 Future market trends
- 3.6 Gap analysis
- 3.7 Technological landscape
- 3.8 Porter's analysis
- 3.9 PESTEL analysis
Chapter 4 Competitive Landscape, 2024
- 4.1 Introduction
- 4.2 Company market share analysis
- 4.3 Company matrix analysis
- 4.4 Competitive analysis of major market players
- 4.5 Competitive positioning matrix
- 4.6 Strategy dashboard
Chapter 5 Market Estimates and Forecast, By Component, 2021 – 2034 ($ Mn)
- 5.1 Key trends
- 5.2 Implants
- 5.2.1 Knee arthroplasty
- 5.2.2 Hip arthroplasty
- 5.2.3 Spine fusion
- 5.2.4 Fracture fixation
- 5.2.5 Other implants
- 5.3 Electronic components
Chapter 6 Market Estimates and Forecast, By Application, 2021 – 2034 ($ Mn)
- 6.1 Key trends
- 6.2 Spinal fusion and fixation
- 6.3 VCF treatment
- 6.4 Motion preservation/ non - fusion
- 6.5 Spinal decompression
Chapter 7 Market Estimates and Forecast, By Procedure Type, 2021 – 2034 ($ Mn)
- 7.1 Key trends
- 7.2 Total replacement
- 7.3 Partial replacement
- 7.4 Other procedure types
Chapter 8 Market Estimates and Forecast, By End Use, 2021 – 2034 ($ Mn)
- 8.1 Key trends
- 8.2 Hospitals
- 8.3 Ambulatory surgical centers
- 8.4 Specialty clinics
- 8.5 Other end use
Chapter 9 Market Estimates and Forecast, By Region, 2021 – 2034 ($ Mn)
- 9.1 Key trends
- 9.2 North America
- 9.2.1 U.S.
- 9.2.2 Canada
- 9.3 Europe
- 9.3.1 Germany
- 9.3.2 UK
- 9.3.3 France
- 9.3.4 Spain
- 9.3.5 Italy
- 9.3.6 Netherlands
- 9.4 Asia Pacific
- 9.4.1 China
- 9.4.2 India
- 9.4.3 Japan
- 9.4.4 Australia
- 9.4.5 South Korea
- 9.5 Latin America
- 9.5.1 Brazil
- 9.5.2 Mexico
- 9.5.3 Argentina
- 9.6 Middle East and Africa
- 9.6.1 Saudi Arabia
- 9.6.2 South Africa
- 9.6.3 UAE
Chapter 10 Company Profiles
- 10.1 Canary Medical
- 10.2 Exactech
- 10.3 Medtronic
- 10.4 SpineGuard
- 10.5 Stryker
- 10.6 Zimmer Biomet
