|
시장보고서
상품코드
1708194
상용차 요소 탱크 시장 기회, 성장 촉진요인, 산업 동향 분석 및 예측(2025-2034년)Commercial Vehicle Urea Tank Market Opportunity, Growth Drivers, Industry Trend Analysis, and Forecast 2025 - 2034 |
||||||
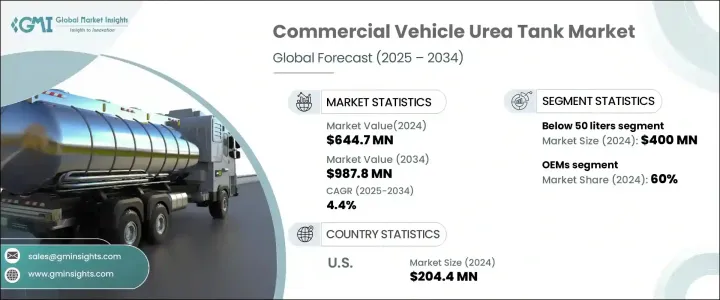
상용차 요소 탱크 세계 시장은 2024년에 6억 4,470만 달러에 달했고, 2025-2034년 연평균 4.4% 성장할 것으로 예측됩니다.
시장 성장의 주요 요인은 엄격한 환경 규제, 선택적 촉매 환원(SCR) 시스템 채택 증가, 유해한 질소산화물(NOx) 배출량 저감 노력 강화 등입니다. 유럽연합(EU), 인도, 중국 등 세계 각국의 정부 및 규제 기관은 Euro VI, Bharat Stage VI(BS-VI), China VI와 같은 엄격한 배출 기준을 시행하고 있으며, 상용차 제조업체는 첨단 요소수 분사 기술을 통합해야 합니다. 이러한 시스템은 배기가스 규제를 준수하는 동시에 연료 효율과 성능을 향상시킬 수 있습니다.
또한, NOx 배출이 공중 보건과 환경에 미치는 악영향에 대한 인식이 높아짐에 따라 차량 사업자들은 SCR 시스템이 장착된 차량에 대한 투자를 늘리고 있습니다. 규제 요건을 충족하는 저연비 차량에 대한 수요 증가는 우레아 탱크의 채택을 더욱 촉진하여 시장의 지속적인 성장에 기여하고 있습니다. 첨단 배기가스 제어 시스템을 탑재한 신형 모델로 구형 상용차를 교체하는 추세도 시장 성장에 기여하고 있으며, 전자상거래 및 도시형 배송 서비스 확대 등 물류 및 운송 분야의 변화도 효율적인 배기가스 제어 시스템을 탑재한 상용차에 대한 수요를 증가시키고 있습니다.
| 시장 범위 | |
|---|---|
| 시작 연도 | 2024년 |
| 예측 연도 | 2025-2034년 |
| 시작 금액 | 6억 4,470만 달러 |
| 예상 금액 | 9억 8,780만 달러 |
| CAGR | 4.4% |
상용차 요소 탱크 시장은 용량별로 50리터 미만, 50-100리터, 100리터 이상의 세 가지로 구분되며, 50리터 미만 부문은 2024년 4억 달러에 달했으며, 배달용 밴, 시내버스 등 중소형 상용차에 광범위하게 적용되어 지속적으로 시장을 독점할 것으로 예측됩니다. 시장을 독점하고 있습니다. 이들 차량은 단거리 노선을 운행하기 때문에 우레아 탱크의 소형화로 인한 차량 중량 감소, 연료 효율 향상, 운행 비용 절감 등의 이점이 있습니다. 소형 탱크 제조의 비용 효율성과 도시 교통 수요에 대한 적합성이 이 부문의 성장을 가속하고 있습니다.
판매 채널에 따라 시장은 OEM(주문자상표부착생산)과 애프터마켓이 주요 기여자이며, OEM 부문은 2024년 60% 시장 점유율을 차지했으며, 이는 주로 새로 생산되는 상용차에 SCR 시스템의 통합이 증가하고 있기 때문인 것으로 분석됩니다. 엄격한 배기가스 규제가 의무화됨에 따라 SCR 기술은 신차에 표준으로 장착되고 있으며, OEM이 직접 공급하는 요소 탱크에 대한 안정적인 수요를 견인하고 있으며, OEM 공급 부품은 높은 품질 기준, 차량 모델과의 호환성, 배기가스 규제를 충족하는 신뢰성으로 인해 선호되고 있습니다.
미국의 상용차 요소 탱크 시장은 2024년에 2억 4,400만 달러 규모에 달했으며, 2025년부터 2034년까지 4.7%의 연평균 복합 성장률(CAGR)을 보일 것으로 전망됩니다. 이러한 성장의 원동력은 환경보호청(EPA)과 같은 기관의 엄격한 배출 규제와 상용차의 SCR 시스템 사용 증가에 기인하며, EPA의 온실가스 2단계 규제와 캘리포니아 대기자원국(CARB)의 의무화로 인해 소형 상용차와 대형 상용차 모두에서 우레아 탱크에 대한 수요가 크게 증가하고 있습니다. 수요가 크게 증가하고 있습니다. 미국이 지속적으로 청정 운송 기술과 배출 기준 강화를 추진함에 따라 고성능 우레아 탱크에 대한 수요는 꾸준히 증가하여 향후 몇 년 동안 시장 성장을 더욱 촉진할 것으로 예측됩니다.
목차
제1장 조사 방법과 조사 범위
제2장 주요 요약
제3장 업계 인사이트
- 생태계 분석
- 공급업체 상황
- 원재료 제조업체
- 부품 제조업체
- 제조업체
- 기술 제공업체
- 유통 채널 분석
- 최종 용도
- 이익률 분석
- 공급업체 상황
- 기술 및 혁신 전망
- 특허 분석
- 규제 상황
- 비용 내역 분석
- 주요 뉴스 및 이니셔티브
- 영향요인
- 성장 촉진요인
- 업계의 잠재적 리스크&과제
- 성장 가능성 분석
- Porter's Five Forces 분석
- PESTEL 분석
제4장 경쟁 구도
- 서론
- 기업 점유율 분석
- 경쟁 포지셔닝 매트릭스
- 전략 전망 매트릭스
제5장 시장 추산 및 예측 : 용량별, 2021년-2034년
- 주요 동향
- 50리터 미만
- 50-100리터
- 100리터 이상
제6장 시장 추산 및 예측 : 재료별, 2021년-2034년
- 주요 동향
- 스테인리스
- 플라스틱
- 복합재료
제7장 시장 추산 및 예측 : 용도별, 2021-2034년
- 주요 동향
- 소형 상용차(LCV)
- 중형 상용차(MCV)
- 대형 상용차(HCV)
제8장 시장 추산 및 예측 : 판매채널별, 2021년-2034년
- 주요 동향
- OEM
- 애프터마켓
제9장 시장 추산 및 예측 : 지역별, 2021년-2034년
- 주요 동향
- 북미
- 미국
- 캐나다
- 유럽
- 독일
- 프랑스
- 영국
- 스페인
- 이탈리아
- 러시아
- 북유럽
- 아시아태평양
- 중국
- 인도
- 일본
- 한국
- 뉴질랜드
- 동남아시아
- 라틴아메리카
- 브라질
- 멕시코
- 아르헨티나
- 중동 및 아프리카
- 아랍에미리트(UAE)
- 남아프리카공화국
- 사우디아라비아
제10장 기업 개요
- ACGB
- Amphenol
- Centro Incorporated
- Cummins
- Dongguan Zhengyang Electronic Mechanical(KUS Auto)
- Elkamet
- Elkhart Plastics
- Gemini Group
- Hitachi Zosen
- ITB Group
- KaiLong
- Kingspan
- Robert Bosch
- Rochling
- Salzburger Aluminium
- Scania AB
- Shaw Development
- Solar Plastics
- SSI Technologies
- Yara International ASA
The Global Commercial Vehicle Urea Tank Market reached USD 644.7 million in 2024 and is projected to grow at a CAGR of 4.4% between 2025 and 2034. The market growth is primarily driven by stringent environmental regulations, rising adoption of selective catalytic reduction (SCR) systems, and increasing efforts to reduce harmful nitrogen oxide (NOx) emissions. Governments and regulatory bodies worldwide, such as the European Union, India, and China, are enforcing strict emission standards, including Euro VI, Bharat Stage VI (BS-VI), and China VI, which require commercial vehicle manufacturers to integrate advanced urea injection technologies. These systems enhance fuel efficiency and performance while ensuring compliance with emission norms.
Additionally, rising awareness about the adverse effects of NOx emissions on public health and the environment is encouraging fleet operators to invest in vehicles equipped with SCR systems. Growing demand for fuel-efficient vehicles that comply with regulatory requirements is further driving the adoption of urea tanks, positioning the market for sustained growth. The increasing replacement of older commercial vehicles with newer models featuring advanced emission control systems is another factor contributing to the market's upward trajectory. Evolving trends in the logistics and transportation sectors, including the expansion of e-commerce and urban delivery services, are also boosting the demand for commercial vehicles with efficient emission control systems.
| Market Scope | |
|---|---|
| Start Year | 2024 |
| Forecast Year | 2025-2034 |
| Start Value | $644.7 Million |
| Forecast Value | $987.8 Million |
| CAGR | 4.4% |
The commercial vehicle urea tank market is segmented by capacity into three categories: below 50 liters, 50 to 100 liters, and above 100 liters. The below 50 liters segment generated USD 400 million in 2024 and continues to dominate the market due to its widespread application in light and medium-duty commercial vehicles, such as delivery vans and urban buses. These vehicles operate on shorter routes and benefit from smaller urea tanks that reduce vehicle weight, enhance fuel efficiency, and lower operational costs. The cost-effectiveness of manufacturing smaller tanks and their compatibility with urban transport needs are driving this segment's growth.
The market is also divided based on sales channels, with Original Equipment Manufacturers (OEMs) and the aftermarket being the key contributors. The OEMs segment held a 60% market share in 2024, largely due to the increasing integration of SCR systems in newly manufactured commercial vehicles. As stricter emission standards become mandatory, SCR technology is becoming a standard feature in new vehicles, driving consistent demand for urea tanks supplied directly by OEMs. The preference for OEM-supplied components stems from their high-quality standards, compatibility with vehicle models, and reliability in meeting emission regulations.
The U.S. commercial vehicle urea tank market generated USD 204.4 million in 2024 and is expected to grow at a CAGR of 4.7% between 2025 and 2034. This growth is fueled by stringent emission regulations enforced by agencies such as the Environmental Protection Agency (EPA) and the increasing use of SCR systems in commercial vehicles. The implementation of the EPA's Greenhouse Gas Phase 2 regulations and California Air Resources Board (CARB) mandates has significantly boosted the demand for urea tanks in both light and heavy commercial vehicles. As the U.S. continues to push for cleaner transportation technologies and tighter emission standards, the demand for high-performance urea tanks is expected to rise steadily, further enhancing the growth of the market in the coming years.
Table of Contents
Chapter 1 Methodology & Scope
- 1.1 Research design
- 1.1.1 Research approach
- 1.1.2 Data collection methods
- 1.2 Base estimates & calculations
- 1.2.1 Base year calculation
- 1.2.2 Key trends for market estimation
- 1.3 Forecast model
- 1.4 Primary research and validation
- 1.4.1 Primary sources
- 1.4.2 Data mining sources
- 1.5 Market scope & definition
Chapter 2 Executive Summary
- 2.1 Industry 3600 synopsis, 2021 - 2034
Chapter 3 Industry Insights
- 3.1 Industry ecosystem analysis
- 3.1.1 Supplier landscape
- 3.1.1.1 Raw material providers
- 3.1.1.2 Component providers
- 3.1.1.3 Manufacturers
- 3.1.1.4 Technology providers
- 3.1.1.5 Distribution channel analysis
- 3.1.1.6 End use
- 3.1.2 Profit margin analysis
- 3.1.1 Supplier landscape
- 3.2 Technology & innovation landscape
- 3.3 Patent analysis
- 3.4 Regulatory landscape
- 3.5 Cost breakdown analysis
- 3.6 Key news & initiatives
- 3.7 Impact forces
- 3.7.1 Growth drivers
- 3.7.1.1 Growth in commercial vehicle production & fleet expansion
- 3.7.1.2 Advancements in urea tank technology
- 3.7.1.3 Stringent emission regulations
- 3.7.1.4 Expansion of logistics & transportation industry
- 3.7.2 Industry pitfalls & challenges
- 3.7.2.1 High initial costs of SCR systems & urea tanks
- 3.7.2.2 Issues with urea crystallization & freezing
- 3.7.1 Growth drivers
- 3.8 Growth potential analysis
- 3.9 Porter's analysis
- 3.10 PESTEL analysis
Chapter 4 Competitive Landscape, 2024
- 4.1 Introduction
- 4.2 Company market share analysis
- 4.3 Competitive positioning matrix
- 4.4 Strategic outlook matrix
Chapter 5 Market Estimates & Forecast, By Capacity, 2021 - 2034 ($Mn, Units)
- 5.1 Key trends
- 5.2 Below 50 liters
- 5.3 50 to 100 liters
- 5.4 Above 100 liters
Chapter 6 Market Estimates & Forecast, By Material, 2021 - 2034 ($Mn, Units)
- 6.1 Key trends
- 6.2 Stainless steel
- 6.3 Plastic
- 6.4 Composite
Chapter 7 Market Estimates & Forecast, By Application, 2021 - 2034 ($Mn, Units)
- 7.1 Key trends
- 7.2 Light Commercial Vehicles (LCV)
- 7.3 Medium Commercial Vehicles (MCV)
- 7.4 Heavy Commercial Vehicles (HCV)
Chapter 8 Market Estimates & Forecast, By Sales Channel, 2021 - 2034 ($Mn, Units)
- 8.1 Key trends
- 8.2 OEM
- 8.3 Aftermarket
Chapter 9 Market Estimates & Forecast, By Region, 2021 - 2034 ($Mn, Units)
- 9.1 Key trends
- 9.2 North America
- 9.2.1 U.S.
- 9.2.2 Canada
- 9.3 Europe
- 9.3.1 Germany
- 9.3.2 France
- 9.3.3 UK
- 9.3.4 Spain
- 9.3.5 Italy
- 9.3.6 Russia
- 9.3.7 Nordics
- 9.4 Asia Pacific
- 9.4.1 China
- 9.4.2 India
- 9.4.3 Japan
- 9.4.4 South Korea
- 9.4.5 ANZ
- 9.4.6 Southeast Asia
- 9.5 Latin America
- 9.5.1 Brazil
- 9.5.2 Mexico
- 9.5.3 Argentina
- 9.6 MEA
- 9.6.1 UAE
- 9.6.2 South Africa
- 9.6.3 Saudi Arabia
Chapter 10 Company Profiles
- 10.1 ACGB
- 10.2 Amphenol
- 10.3 Centro Incorporated
- 10.4 Cummins
- 10.5 Dongguan Zhengyang Electronic Mechanical (KUS Auto)
- 10.6 Elkamet
- 10.7 Elkhart Plastics
- 10.8 Gemini Group
- 10.9 Hitachi Zosen
- 10.10 ITB Group
- 10.11 KaiLong
- 10.12 Kingspan
- 10.13 Robert Bosch
- 10.14 Rochling
- 10.15 Salzburger Aluminium
- 10.16 Scania AB
- 10.17 Shaw Development
- 10.18 Solar Plastics
- 10.19 SSI Technologies
- 10.20 Yara International ASA