


|
시장보고서
상품코드
1716636
버스 배차 관리 시스템 소프트웨어 시장 기회, 성장 촉진요인, 산업 동향 분석 및 예측(2025-2034년)Bus Dispatch Management System Software Market Opportunity, Growth Drivers, Industry Trend Analysis, and Forecast 2025 - 2034 |
||||||
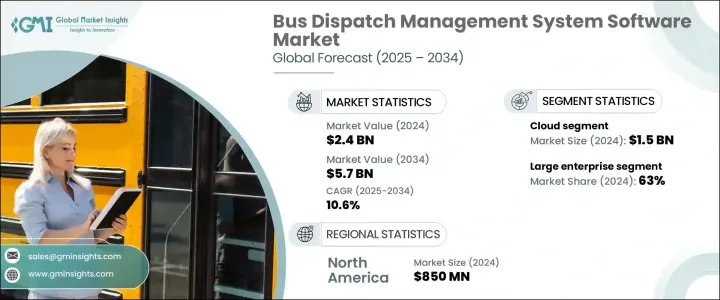
세계의 버스 배차 관리 시스템 소프트웨어 시장은 2024년에 24억 달러로 평가되었고, 2025년부터 2034년에 걸쳐 CAGR 10.6%를 나타낼 것으로 예측됩니다.
이 시장은 대중 교통 기술에 대한 투자가 증가하고 효율적인 차량 관리 솔루션에 대한 요구가 증가함에 따라 급속히 확대되고 있습니다. 전반적인 모니터링을 간소화하는 첨단 소프트웨어 솔루션에 주목하고 있습니다. 대중 교통 인프라의 디지털화로의 전환은 세계 도시가보다 스마트하고 지속 가능한 모빌리티 솔루션을 선호하면서 수요를 더욱 가속화하고 있습니다.

도시화가 진행됨에 따라 정비된 신뢰성이 높은 대중 교통망의 필요성이 중요해지고 있습니다. 운행과 통근자의 편리성 향상을 실현합니다. 정부나 민간 교통기관은 지연의 삭감, 연료 효율의 향상, 운행 코스트의 최소화를 목표로 해, 이러한 기술에 적극적으로 투자하고 있습니다. 또한 친환경 대중교통 솔루션에 대한 요구가 증가함에 따라 전기 및 하이브리드 차량 관리를 통합하는 버스 배차 소프트웨어에 대한 수요도 증가하고 있습니다.
| 시장 범위 | |
|---|---|
| 시작 연도 | 2024년 |
| 예측 연도 | 2025-2034년 |
| 시작 금액 | 24억 달러 |
| 예측 금액 | 57억 달러 |
| CAGR | 10.6% |
시장은 주로 배포 모델을 기반으로 부문화되며 클라우드 솔루션과 온프레미스 솔루션은 2가지 범주로 분류됩니다. 클라우드 솔루션이 2024년에 15억 달러를 창출하며 이 부문을 지배했으며, 2025년부터 2034년까지 연평균 11%의 성장률을 나타낼 것으로 예상됩니다. 클라우드 배차 관리 소프트웨어는 비교할 수 없는 확장성을 제공하며, 운송 회사는 규모에 관계없이 차량 운행을 원활하게 관리할 수 있습니다. - 또는 배차 담당자는 인터넷 연결이 있으면 어디에서나 실시간 운영을 모니터링할 수 있습니다.
시장을 기업 규모별로 분석하면 대기업이 압도적인 지위를 차지하고 있으며, 2024년 시장 점유율의 63%를 차지했습니다. 예측 분석, AI 주도 최적화 툴을 통해 대규모 조직에 힘을 주고 차량의 성능을 향상시키고 다운타임을 삭감합니다.
북미는 버스 배차 관리 시스템 소프트웨어 시장을 35%의 점유율로 선도해 2024년에는 8억 5,000만 달러를 창출하였습니다. 업무에 있어서 AI, IoT, 클라우드 컴퓨팅의 통합이 진행되고 있기 때문입니다.
목차
제1장 조사 방법과 조사 범위
제2장 주요 요약
제3장 업계 인사이트
- 생태계 분석
- 공급자의 상황
- 소프트웨어 개발 벤더
- 하드웨어 제공업체
- 시스템 통합자
- 통신회사
- 교통기관/운행회사
- 이익률 분석
- 가격 동향
- 기술 혁신의 상황
- 특허 분석
- 사례 연구
- 주요 뉴스
- 규제 상황
- 영향요인
- 성장 촉진요인
- 효율적인 대중교통에 대한 수요 증가
- 도시화의 진전과 인구 증가
- 대중교통 기술에 대한 투자 증가
- 자동차 센서 기술의 성장
- 업계의 잠재적 위험 및 과제
- 인터넷 접속의 제한과 인프라의 한계
- 기존의 교통기관이나 이해 관계자로부터의 저항
- 성장 촉진요인
- 성장 가능성 분석
- Porter's Five Forces 분석
- PESTEL 분석
제4장 경쟁 구도
- 서론
- 기업 점유율 분석
- 경쟁 포지셔닝 매트릭스
- 전략 전망 매트릭스
제5장 시장 추계·예측 : 배포 모델별(2021-2034년)
- 주요 동향
- 온프레미스
- 클라우드
제6장 시장 추계·예측 : 기업 규모별(2021-2034년)
- 주요 동향
- 대기업
- 중소기업
제7장 시장 추계·예측 : 용도별(2021-2034년)
- 주요 동향
- 경로 최적화
- 실시간 추적
- 차량 관리
- 배차 및 통신
- 기타
제8장 시장 추계·예측 : 최종 용도별(2021-2034년)
- 주요 동향
- 대중교통기관
- 개인 버스 사업자
- 교육기관
- 기타
제9장 시장 추계·예측 : 지역별(2021-2034년)
- 주요 동향
- 북미
- 미국
- 캐나다
- 유럽
- 영국
- 독일
- 프랑스
- 이탈리아
- 스페인
- 러시아
- 북유럽
- 아시아태평양
- 중국
- 인도
- 일본
- 한국
- 뉴질랜드
- 동남아시아
- 라틴아메리카
- 브라질
- 멕시코
- 아르헨티나
- 중동 및 아프리카
- UAE
- 사우디아라비아
- 남아프리카
제10장 기업 프로파일
- BusHive
- Cubic Transportation Systems
- Driver Schedule
- GIRO
- Goal Systems
- GPS Insight
- Hudson Software
- IBI Group
- INIT Innovations in Transportation
- Optibus
- Reveal Management Services
- Ride Systems
- Routematch Software
- Samsara Networks
- Syncromatics
- TransLoc
- Trapeze Group
- TripSpark Technologies
- Verizon Connect Reveal
- Zonar Systems
The Global Bus Dispatch Management System Software Market was valued at USD 2.4 billion in 2024 and is projected to grow at a CAGR of 10.6% from 2025 to 2034. The market is experiencing rapid expansion, driven by increasing investments in public transport technology and the rising need for efficient fleet management solutions. With urban populations continuing to grow, transit agencies and transportation providers are turning to advanced software solutions that optimize bus operations, enhance scheduling accuracy, and streamline overall fleet monitoring. The shift toward digitized public transportation infrastructure is further accelerating demand as cities worldwide prioritize smarter, more sustainable mobility solutions.
As urbanization intensifies, the need for well-structured and reliable public transportation networks becomes critical. The surge in urban population results in increased road congestion and higher commuter volumes, necessitating the adoption of intelligent bus dispatch management systems. These advanced platforms enable real-time monitoring, automated scheduling, and AI-powered route optimization, ensuring smooth fleet operations and enhanced commuter experience. Governments and private transit agencies are actively investing in these technologies to reduce delays, improve fuel efficiency, and minimize operational costs. Additionally, the growing push for green and eco-friendly transit solutions is leading to an increased demand for bus dispatch software that integrates electric and hybrid vehicle management.
| Market Scope | |
|---|---|
| Start Year | 2024 |
| Forecast Year | 2025-2034 |
| Start Value | $2.4 Billion |
| Forecast Value | $5.7 Billion |
| CAGR | 10.6% |
The market is primarily segmented based on deployment models, with cloud-based and on-premises solutions being the two major categories. Cloud-based solutions dominated the segment, generating USD 1.5 billion in 2024, and are expected to grow at a CAGR of 11% between 2025 and 2034. Cloud-based dispatch management software offers unparalleled scalability, allowing transportation agencies to seamlessly manage fleet operations regardless of size. These solutions also enable remote access, giving fleet managers and dispatchers the ability to monitor real-time operations from any location with internet connectivity. The flexibility and cost-effectiveness of cloud-based platforms have led to widespread adoption, particularly among transit agencies looking for robust and future-ready solutions.
When analyzing the market by enterprise size, large enterprises held a dominant position, accounting for 63% of the market share in 2024. Public transportation authorities and multinational bus operators with substantial budgets continue to invest in sophisticated bus dispatch management software. These advanced systems empower large organizations with real-time tracking, predictive analytics, and AI-driven optimization tools that enhance fleet performance and reduce downtime. The rising need for automation in large-scale transit operations further fuels market expansion as enterprises seek to improve passenger safety, operational efficiency, and cost management.
North America led the bus dispatch management system software market with a 35% share, generating USD 850 million in 2024. The region's strong market presence is attributed to the growing adoption of smart mobility solutions and the integration of AI, IoT, and cloud computing in transit operations. As transportation agencies continue to modernize their fleet management strategies, demand for advanced bus dispatch software is expected to surge, further driving market growth in the coming years.
Table of Contents
Chapter 1 Methodology & Scope
- 1.1 Research design
- 1.1.1 Research approach
- 1.1.2 Data collection methods
- 1.2 Base estimates and calculations
- 1.2.1 Base year calculation
- 1.2.2 Key trends for market estimates
- 1.3 Forecast model
- 1.4 Primary research & validation
- 1.4.1 Primary sources
- 1.4.2 Data mining sources
- 1.5 Market definitions
Chapter 2 Executive Summary
- 2.1 Industry 3600 synopsis, 2021 - 2034
Chapter 3 Industry Insights
- 3.1 Industry ecosystem analysis
- 3.2 Supplier landscape
- 3.2.1 Software developers/vendors
- 3.2.2 Hardware providers
- 3.2.3 System integrators
- 3.2.4 Telecommunications companies
- 3.2.5 Transit agencies/operators
- 3.3 Profit margin analysis
- 3.4 Price trends
- 3.5 Technology & innovation landscape
- 3.6 Patent analysis
- 3.7 Case study
- 3.8 Key news & initiatives
- 3.9 Regulatory landscape
- 3.10 Impact forces
- 3.10.1 Growth drivers
- 3.10.1.1 Increasing demand for efficient public transportation
- 3.10.1.2 Growing urbanization and population growth
- 3.10.1.3 Increasing investments in public transport technology
- 3.10.1.4 Rising growth of automotive sensor technology
- 3.10.2 Industry pitfalls & challenges
- 3.10.2.1 Limited internet connectivity and infrastructure limitations
- 3.10.2.2 Resistance from traditional transit agencies or stakeholders
- 3.10.1 Growth drivers
- 3.11 Growth potential analysis
- 3.12 Porter's analysis
- 3.13 PESTEL analysis
Chapter 4 Competitive Landscape, 2024
- 4.1 Introduction
- 4.2 Company market share analysis
- 4.3 Competitive positioning matrix
- 4.4 Strategic outlook matrix
Chapter 5 Market Estimates & Forecast, By Deployment Model, 2021 - 2034 ($Bn)
- 5.1 Key trends
- 5.2 On-premises
- 5.3 Cloud
Chapter 6 Market Estimates & Forecast, By Enterprise Size, 2021 - 2034 ($Bn)
- 6.1 Key trends
- 6.2 Large enterprises
- 6.3 SME
Chapter 7 Market Estimates & Forecast, By Application, 2021 - 2034 ($Bn)
- 7.1 Key trends
- 7.2 Route optimization
- 7.3 Real-time tracking
- 7.4 Fleet management
- 7.5 Dispatch and communication
- 7.6 Others
Chapter 8 Market Estimates & Forecast, By End Use, 2021 - 2034 ($Bn)
- 8.1 Key trends
- 8.2 Public transit agencies
- 8.3 Private bus operators
- 8.4 Educational institutions
- 8.5 Others
Chapter 9 Market Estimates & Forecast, By Region, 2021 - 2034 ($Bn)
- 9.1 Key trends
- 9.2 North America
- 9.2.1 U.S.
- 9.2.2 Canada
- 9.3 Europe
- 9.3.1 UK
- 9.3.2 Germany
- 9.3.3 France
- 9.3.4 Italy
- 9.3.5 Spain
- 9.3.6 Russia
- 9.3.7 Nordics
- 9.4 Asia Pacific
- 9.4.1 China
- 9.4.2 India
- 9.4.3 Japan
- 9.4.4 South Korea
- 9.4.5 ANZ
- 9.4.6 Southeast Asia
- 9.5 Latin America
- 9.5.1 Brazil
- 9.5.2 Mexico
- 9.5.3 Argentina
- 9.6 MEA
- 9.6.1 UAE
- 9.6.2 Saudi Arabia
- 9.6.3 South Africa
Chapter 10 Company Profiles
- 10.1 BusHive
- 10.2 Cubic Transportation Systems
- 10.3 Driver Schedule
- 10.4 GIRO
- 10.5 Goal Systems
- 10.6 GPS Insight
- 10.7 Hudson Software
- 10.8 IBI Group
- 10.9 INIT Innovations in Transportation
- 10.10 Optibus
- 10.11 Reveal Management Services
- 10.12 Ride Systems
- 10.13 Routematch Software
- 10.14 Samsara Networks
- 10.15 Syncromatics
- 10.16 TransLoc
- 10.17 Trapeze Group
- 10.18 TripSpark Technologies
- 10.19 Verizon Connect Reveal
- 10.20 Zonar Systems

